AI Crypto Analysis Explained: Methods, Data and Limits
How ai crypto analysis works for Solana meme coins: data sources, risk signals, a real token timeline and the limits of AI risk reports.
Published
Updated
A new Solana meme coin can look busy, liquid, and popular while almost none of that activity is real demand. Traders who treat volume as proof of interest are reading the wrong gauge. AI crypto analysis starts from a harder pair of questions. What can anyone actually know at minute five, hour one, and hour 24? And how much of the activity is genuine rather than arranged?
The machinery is closer to a lab instrument than a fortune teller. It pulls live chain and market records, scores several risk signals together, and writes the result in plain language. Speed matters as much as the score. Evidence in the first minutes is thinner than evidence a day later, and a model that waits for a perfect picture often waits too long.
What follows is the path from raw records to a verdict you can argue with. Data goes in, signals get scored, a launch is read window by window, fake volume is separated from real demand, and the limits stay in view before any number becomes a reason to buy.
Table of Contents
- What AI Crypto Analysis Actually Means
- The Data Sources an AI Analyzer Reads
- How Models Combine Signals Into One Score
- A Solana Meme Coin From Launch to 24 Hours
- Separating Real Demand From Manufactured Volume
- Where AI Analysis Breaks Down
- Checking an AI Verdict Before You Buy
What AI Crypto Analysis Actually Means
Chainalysis estimated that cryptocurrency scams received at least $9.9 billion on-chain during 2024, and noted the figure could rise as investigators identify more illicit addresses. That is an on-chain estimate, not a complete tally of every loss, and it depends on address attribution and later revisions. The same reporting described artificial intelligence as a factor in fraud, including highly personalized attacks. Manual review of wallets can't cover a market that moves this fast.
AI crypto analysis is software that gathers on-chain and market data, measures several risk signals at once, and explains the result in words a trader can act on.

A smoke detector is the right picture. It reads heat, smoke, and gas together, then raises an alarm. It doesn't tell you who lit the match, and it doesn't promise the next room is safe. A risk model does the same job with wallets, pools, and trades. It flags a condition. It doesn't certify intent.
Price forecasting is a different job. Predicting the next candle asks where price might go. Risk analysis asks whether the behaviour around that price looks suspicious before money is lost. A single predicted price, stated as certainty, is the wrong output. Several measurable signals, stated with their evidence, is the defensible one.
Three stages sit underneath every report. Records go in. Those records become scored signals. A written verdict comes back with the evidence still attached, so you can disagree with it.
Read this way, you can open a Solana meme-coin risk report, see which checks produced the number, and know where the model is guessing.
The Data Sources an AI Analyzer Reads
An analyzer is only as honest as the records it reads. Seven sources do most of the work. Each one reveals something real, feeds one risk signal, and fails in a specific way.
| Data source | What it reveals | Risk signal it feeds | Main limitation |
|---|---|---|---|
| Mint and freeze authorities | Whether the creator can print new supply or freeze holder accounts | Contract permission risk | Shows permission, not intent |
| Liquidity pool events | Additions, removals, and last interaction time | Liquidity removal and pool abandonment | Legitimate migrations can look like exits |
| Holder distribution | Share of supply held by the largest wallets | Concentration risk | Exchange and liquidity wallets can distort the count |
| Creator wallet history | Earlier launches, linked wallets, and withdrawal share | Creator behaviour risk | Empty for first-time creators |
| Wallet and trading activity | Repeat counterparties, bundled first-block buys, and holding periods | Insider and bundle patterns | Needs complete transaction history |
| Market and price data | Price structure, volume, and price-volume divergence | Momentum quality and trade conditions | Volume can be manufactured |
| Historical risk indicators | Outcomes of earlier flagged tokens | Calibration of the score | Only as reliable as the labelled history |
Two of these fool beginners more often than the rest.
Mint and freeze settings look like a verdict on the creator. They aren't. An active mint authority means new supply can be printed. It doesn't mean the creator will print it. A revoked authority removes that lever. It doesn't make the token safe.
Holder distribution looks like a clean pie chart of who owns the coin. Exchange wallets, the liquidity pool itself, and routing accounts often sit near the top. Count them as "whales" and the concentration signal is fiction. A useful report labels those wallets instead of folding them into the top-holder share.
Why a cached snapshot lies
A Solana research dataset built from about 3.69 billion transactions across 2021 to 2024 holds 62,895 suspicious liquidity pools, annotated for inactivity, liquidity added and removed, last interaction, and amounts withdrawn. That scale is the point. A pool can go from active trading to abandoned in minutes. A cached snapshot taken after the exit can still look healthy if it froze the earlier state. Sequential monitoring catches the transition. A stale picture cannot.
The fields support a causal read, not a guilty verdict. Risk rises when liquidity leaves quickly, pool activity stops abruptly, or withdrawals are large relative to what was added. Time-normalized measures beat raw totals. Liquidity removed as a percentage, minutes from pool creation to a major withdrawal, the creator-linked share of that withdrawal, and trading activity against surviving liquidity all travel better than a single balance.
Similar traces appear in legitimate migrations, market-maker changes, and abandoned launches. Treat them as evidence, not proof of fraud.
Before you trust a report, check that it cites sources you can re-open:
- Authorities. Mint and freeze status, with the account named.
- The pool. Adds, removes, and the time of the last interaction.
- Holders. Top wallets, with exchange and pool addresses separated.
- The creator. Earlier launches and linked withdrawals, or an explicit "no history."
- Trades. Repeat counterparties and first-block bundles, not a volume total alone.
- Price. Structure and divergence, not a green candle.
- History. How earlier flags of this type resolved.
If a line in the verdict has no row behind it, that line is narration.
How Models Combine Signals Into One Score
Raw evidence isn't a score. Something has to weigh it. The honest path runs from simple rules, which you can audit, to learned models, which catch interactions nobody wrote down. No single family deserves the last word.
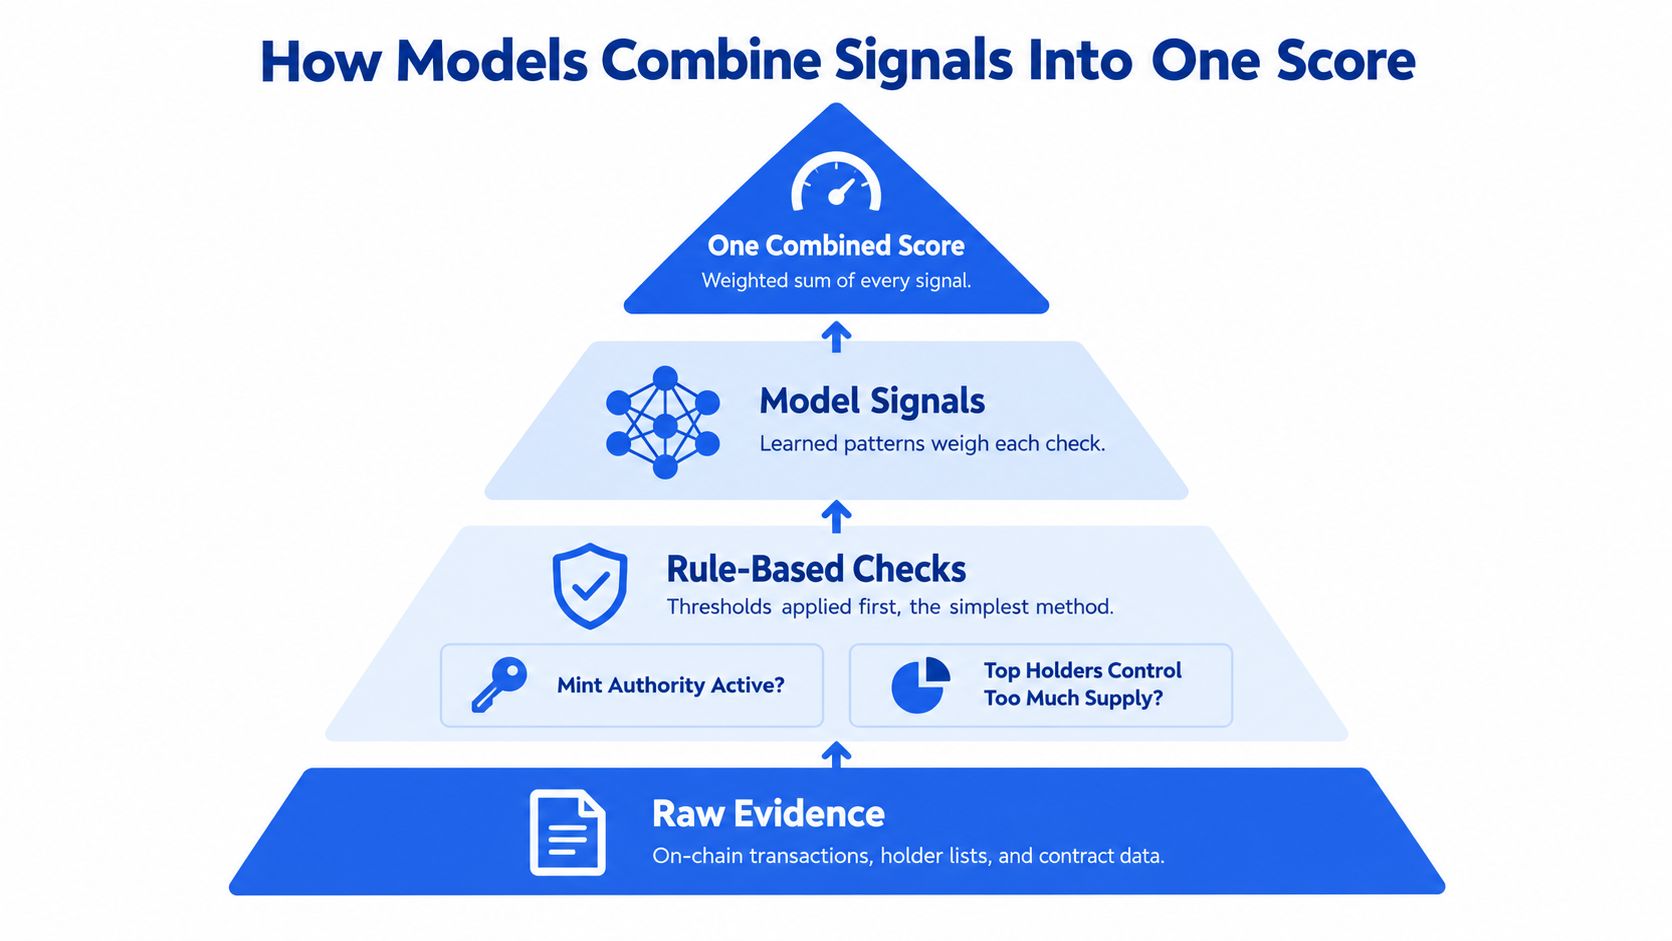
Rule-based thresholds come first because they're legible. Is mint authority still active? Do the top holders control more than a set share of supply? A yes is a flag you can point at. The failure mode is anything the author didn't imagine. A circular wallet cluster with a normal-looking holder chart walks straight through.
Gradient-boosted trees take many features at once and learn interactions. A large holder share matters far more when liquidity is thin than when the pool can absorb a sale. That interaction is hard to write as one rule and natural for a tree ensemble. The cost is a large labelled history, and a model that memorizes the last regime instead of the next one.
LSTM sequence models read trades as an ordered series, the way a sentence is an ordered series of words. They pick up short-term structure in noisy markets. They're also hard to explain trade by trade.
A study of daily data for 1,681 cryptocurrencies from November 2015 through April 2018 tested two gradient-boosting models and one LSTM against a simple moving-average rule. All three beat that baseline, and the LSTM produced the strongest and most consistent return on investment. The sample ends in 2018. It shows that models can extract short-term signal from noisy, heterogeneous markets better than a historical average. It doesn't show that a model stays profitable after fees, slippage, thin books, or a regime change.
Anomaly detection sits beside the score rather than inside a price forecast. It asks whether buyer timing, trade gaps, and recurring wallets look far from a normal launch. Unusual timing is informative. On a violent but legitimate open, it also cries wolf.
| Method family | How it works | Where it helps | Where it fails |
|---|---|---|---|
| Rule-based thresholds | Flags a fixed condition such as active mint authority or top-holder share above a set level | Transparent and easy to audit | Misses patterns no rule anticipated |
| Gradient-boosted trees | Combines many features and captures interactions between them | Handles effects such as thin liquidity amplifying concentration | Needs a large labelled history and can overfit |
| LSTM sequence models | Learns from ordered trade sequences over time | Picks up short-term patterns in noisy, time-ordered data | Hard to explain, and past results don't guarantee profit after fees |
| Anomaly detection | Flags behaviour far from normal launch patterns | Surfaces unusual buyer timing and recurring wallets | High false-positive rate on volatile launches |
What a credible score still shows you
A combined score is a weighted summary, not a prophecy. The analyzer that deserves your time keeps the feature behind each point visible and reports a confidence band, not a single certain prediction. Platform habits change false-positive rates. A probability without that context is a costume on a guess.
Practical rule: If the report won't show which signals moved the score, the score isn't finished. It's a label.
A Solana Meme Coin From Launch to 24 Hours
A meme coin opens on a Solana decentralized exchange. The chart jumps, the pool looks funded, and a trader has a few minutes to decide. The useful question isn't whether a model can spot a rug after the fact. It's how early a warning is real, and which evidence exists before the market has settled.
A large-scale study of 6.4 million Solana tokens, collected over seven months, found that most tokens showing rug-pull characteristics did so within the first hour, while machine-learning models reached useful detection from only the first five minutes of trading. Waiting for a complete, high-confidence report can itself be the risk. The damaging sequence is often over before holder charts and volume averages look stable.
That speed has a cost. A five-minute model can call danger early and can also misread a legitimate token in violent price discovery. Confidence should rise only as the window fills in.
| Time window | Evidence available | What the score can support | Confidence |
|---|---|---|---|
| 0 to 5 minutes | Mint and freeze settings, initial liquidity, creator links, first-block buyers | Earliest warning of structural danger | Low to moderate. Volatile launches can be misread |
| 5 to 60 minutes | Holder spread, sell pressure, pool additions and removals | The hour when most rug-pull characteristics in the study appeared | Moderate and rising |
| 1 to 24 hours | Trading rhythm, repeat wallets, pool recovery or abandonment | A stronger read on whether activity is organic | Higher as the statistics settle |
| After 24 hours | Outcome of any flagged token, tracked against later trading | A measure of how accurate earlier flags were | Highest, but retrospective |
Minute five is a sketch
In the first five minutes the report can show authorities, the opening liquidity, wallets tied to the creator, and who bought in the first block. That is structural. It is not a trading history. A bundled cluster of buyers is a reason to slow down. It isn't proof the pool will be drained. Treat this window as an earliest warning, and expect false alarms when price discovery is especially wild.
The hour the pattern usually shows
From five minutes to sixty, holder spread, sell pressure, and pool adds or removes start to mean something. This is the window where most rug-pull characteristics in that Solana study showed up. A rapid removal, an abrupt stop in pool activity, or a withdrawal that is large next to what was added all raise the score. A healthy token can still whip around. The difference is whether liquidity survives the whip.
The day, then the grade
Between hour one and hour 24 the rhythm of trades matters more than the first print. Repeat wallets, short holding periods, and a pool that either refills or goes quiet separate a launch from an exit. After 24 hours the question changes again. The job is no longer "is this dangerous now?" It is "was the earlier flag right?" Tracking a flagged token against later trading is how a screener grades itself. That grade is the most solid number in the sequence, and it arrives after the trade decision is already old.
An early flag is a hypothesis with a clock on it. A day-later outcome is the test. Don't treat them as the same kind of fact.
On a report, map each claim to its window. An Overall Health Score, a Rug Risk Rating, a plain-language AI Verdict, and a Detailed Risk Breakdown only help if you can see whether a line came from minute five or from a full day. A verdict that mixes those windows without saying so is smoother than the evidence.
Separating Real Demand From Manufactured Volume
High volume is the metric most write-ups treat as bullish. Sometimes it's the reason to trust a token less.
A three-month study of meme coins found that 82.6% of tokens returning more than 100% showed artificial growth tactics, including wash trading and liquidity-pool price inflation. The same work logged 1,014 strong wash-trading events across 282 tokens. Solana accounted for 181 manipulated tokens, more than any other chain in the sample. Price appreciation, volume, and wallet growth can be engineered. They aren't independent witnesses.
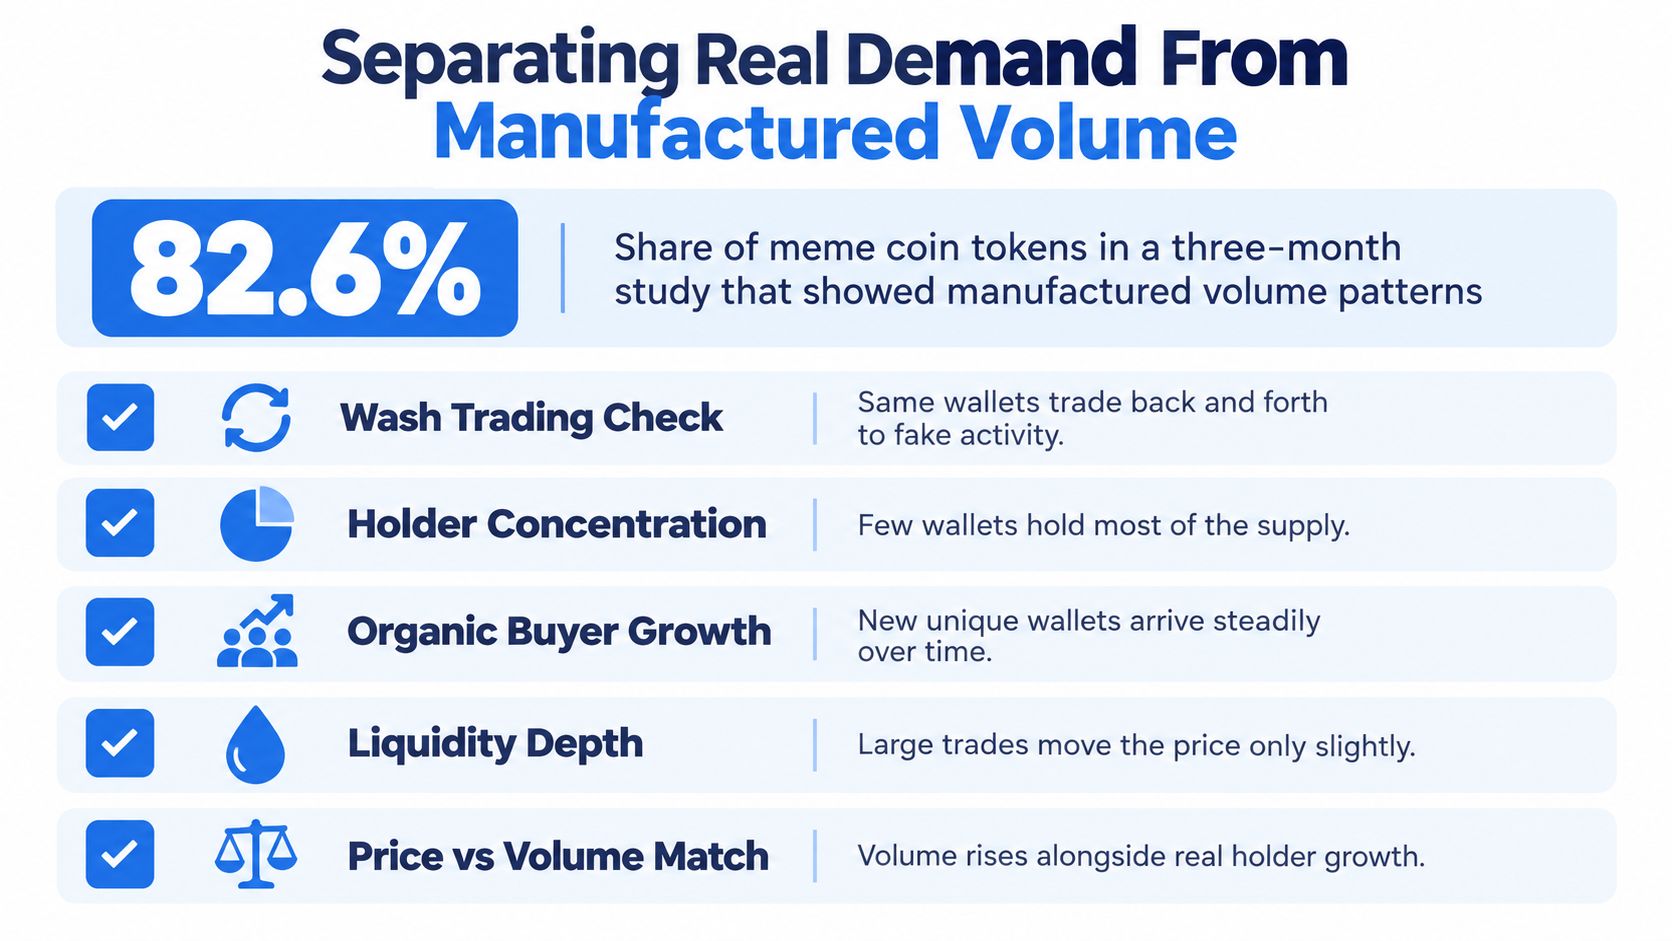
None of this needs a clever exploit. Repeated loops, coordinated small buys, bundled opens, and a thin pool can paint a chart that looks like demand. A model doing AI crypto analysis of authenticity, not just activity, should down-weight the headline return when the trades behind it are circular.
The mechanism is easier to see on a chart than in a definition. This short walkthrough shows how circular trades inflate a tape without new buyers arriving:
Six signs to weigh together
Read these as a set. One of them can be noise. Several at once are a pattern. A closer look at how wash trading shows up on Solana helps when the tape is the only thing that looks strong.
- Same-wallet loops. A small set of wallets buys and sells to itself. Volume rises, and no new holder is taking risk.
- Related small buys in the first block. Many tiny purchases from linked wallets at the open imitate a crowd. The crowd is one operator with several keys.
- A rise on thin liquidity. Price jumps because the pool is shallow, not because demand is deep. A modest sell later erases the move.
- Volume inside a cluster. Most of the tape sits in a handful of recurring wallets. Breadth of participation is what organic demand looks like.
- Synchronized timing. Buys and sells line up in time across those wallets. Independent traders don't share a metronome.
- Price that doesn't match the trades. The print moves farther than the flow behind it can justify. That's divergence, not momentum.
High volume from a small recurring cluster is a warning. It isn't a reason to call the token strong. When the gains depend on shallow liquidity, lower your confidence in the verdict no matter how healthy the headline score looks.
If the price only works while the pool stays thin, the return is a property of the pool, not of demand.
Where AI Analysis Breaks Down
Most crypto activity is ordinary, which is exactly why a scary score needs a base rate.
Chainalysis estimated that illicit cryptocurrency activity in 2024 could exceed $51 billion, while the share of attributed transactions linked to crime was 0.14%, down from 0.61% in 2023. The dollar figure can be huge and the share of transactions still tiny. Read every flag against that background. False positives are the everyday cost of screening, not a rare malfunction.
A model fails in a few repeatable ways.
- Regime change. A model fit on an older market can miss the next one. The machine-learning results from the 2015 to 2018 sample are evidence that signal exists. They aren't a promise of profit after fees, slippage, and liquidity limits.
- Attribution. On-chain loss totals move when investigators label more addresses or revise earlier labels. A precise dollar figure is a snapshot of identification, not a closed set of losses.
- Permission versus intent. Mint and freeze settings show what a creator can do. They don't show what that creator will do.
- Lookalikes. Migrations, market-maker changes, and abandoned launches leave traces that resemble a rug. The chain pattern isn't a court finding.
- Speed versus error. An early model catches danger sooner and mislabels violent but real launches more often. You don't get both perfect recall and a five-minute answer.
We use AI to translate measured token data into explanations a person can read. It isn't an independent expert, and it isn't a substitute for the underlying evidence. If the words and the checks disagree, believe the checks. Comparing signals with later trading, including how health scores look against 24-hour outcomes, is how a screener finds out whether it was early, late, or wrong.
Three ideas to drop
AI doesn't predict prices with certainty. A strong backtest against a moving average isn't a forecast you can spend.
A high score isn't a buy signal. It says the measured checks looked favorable inside one window. It doesn't size a position or pick an entry.
A clean report isn't a guarantee. Labels get revised, liquidity can leave after the run, and a first-time creator has an empty history by definition. Absence of a red flag is not presence of safety.
Checking an AI Verdict Before You Buy
A verdict is a brief. The routine below is how you cross-examine it. Each step exists so you don't outsource the decision to a paragraph.
- Run a free scanner first. A quick pass is enough to drop obvious structural problems before you spend time or money. It isn't the analysis.
- Request a full analysis only if that pass is clean. Our free scanners are a first check. A full analysis explains the evidence behind the health score and rug risk rating, adds an AI verdict and a detailed risk breakdown, and includes a conditional trade plan when the data allows. That full run, with a conditional Trade Setup, costs $0.20. You are paying for the check, not for a trade.
- Read the evidence before the verdict. Open the Overall Health Score and the Rug Risk Rating, and see which signals moved them. The written AI Verdict should come last, as a translation, not as the proof.
- Match the figures to the clock. Holder spread and liquidity mean less at minute five than they do after an hour, and less after an hour than after a day. A number from the wrong window is a different claim. Setting a health score next to manual checks is a useful way to see what the model added and what you still have to confirm yourself.
- Treat any trade plan as a scenario. Entry, stop, and target levels appear only when the current price structure supports them. Those scenarios are analysis, not instructions. They don't predict an outcome, and they don't guarantee a fill at the displayed price.
Memecoins can go to zero. Nothing in a report changes that.
If you can't explain the top three risk items in your own words, you don't yet understand the verdict. Don't act on it. Use the result to decide whether to keep researching, not whether to buy.
MemeAssist runs live Solana token reports that score liquidity, holders, creator behaviour, wallet activity, trading patterns, and historical risk indicators, then explain the result in plain language. If you want that check before you size a position, start with a scan and read the evidence behind the score at MemeAssist. Bring the time window and the volume question with you, and keep the verdict only if you can restate its top risks yourself.