Altcoin Season Meaning and How to Spot It in 2026
Learn the altcoin season meaning, the metrics that signal it, and how to trade the rotation without falling for every Solana meme-coin rally.
Published
Updated
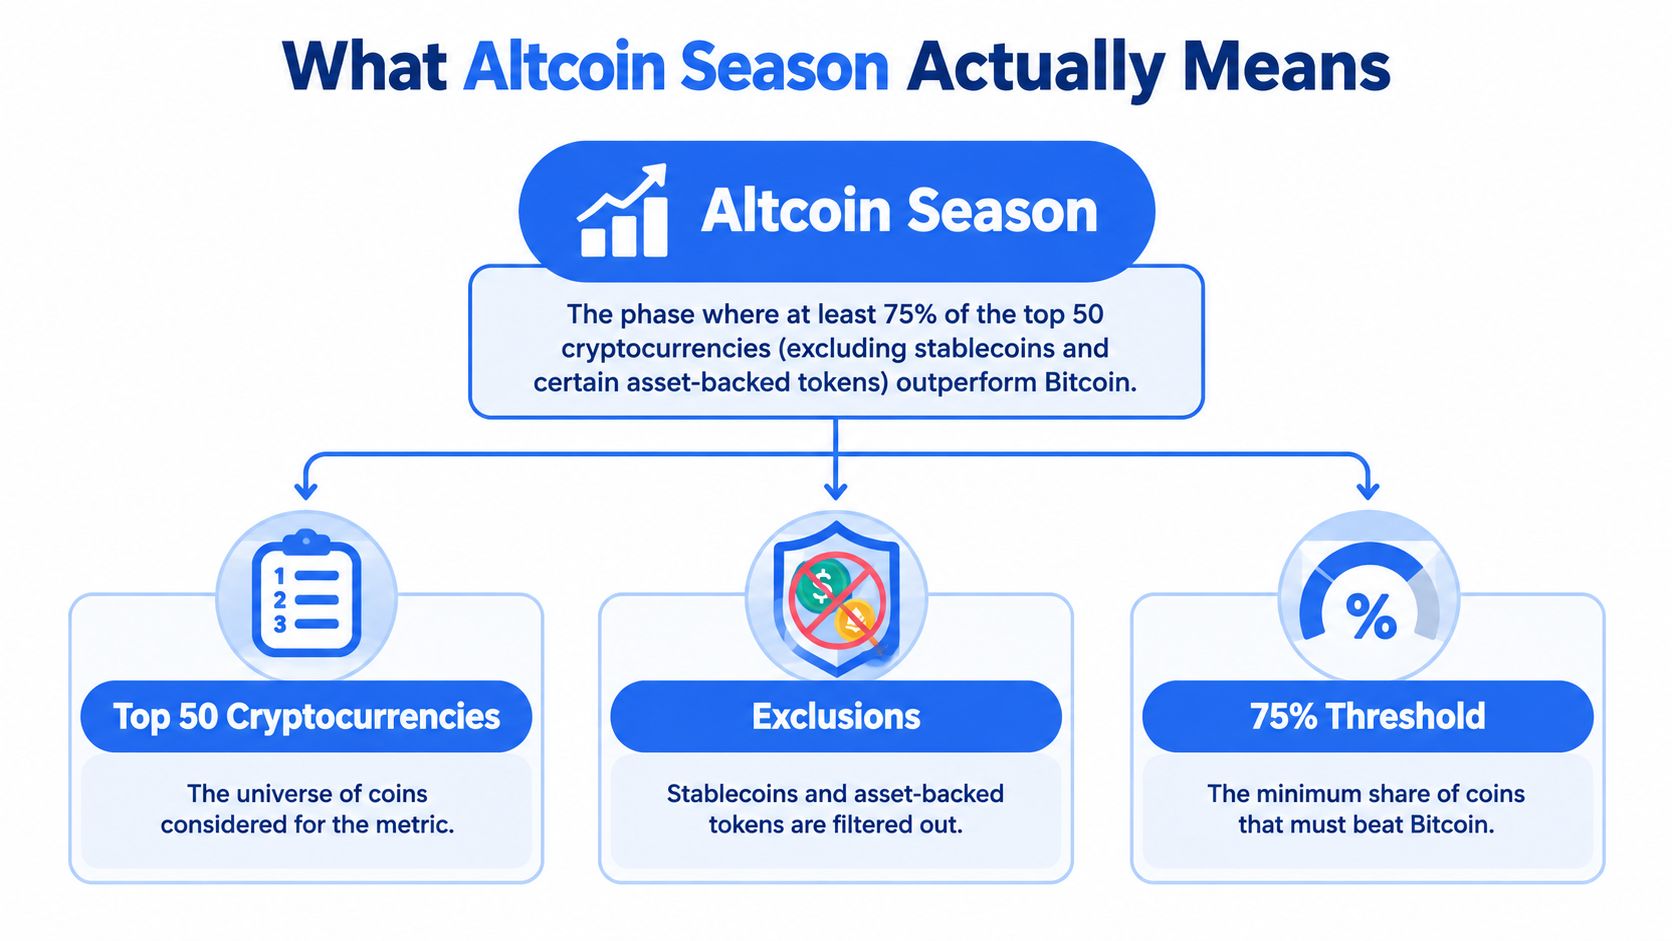
Altcoin season is the market phase where at least 75 percent of the top 50 cryptocurrencies, excluding stablecoins and certain asset-backed tokens, outperform Bitcoin over a rolling 90-day window. That means at least 38 coins must beat Bitcoin, not just a handful of tokens dominating your feed.
The distinction changes how you trade. A Solana meme coin can rally while the broader altcoin market struggles, and a strong market-wide signal can coexist with an individual token you shouldn't touch. Understanding altcoin season meaning starts with separating those decisions: whether the market favors altcoin exposure, which sector traders are buying, and whether your chosen token passes a risk check.
Table of Contents
- What Altcoin Season Actually Means
- Bitcoin Dominance and the Macro Rotation
- The Signals Traders Actually Watch
- Sector Rotation vs Broad Altcoin Season
- When the Old Signals Stop Working
- Why Solana Meme-Coin Rallies Cut Both Ways
- A Practical Playbook for the Rotation
What Altcoin Season Actually Means
Altcoins are cryptocurrencies other than Bitcoin. Altcoin season describes widespread relative strength across those assets, rather than a rally in whichever coin currently attracts the most attention.
Under BlockchainCenter's Altcoin Season Index methodology, at least 75% of the top 50 eligible cryptocurrencies, excluding stablecoins and certain asset-backed tokens, must outperform Bitcoin over the previous 90 days, meaning at least 38 coins must qualify; readings of 25 or below indicate Bitcoin season, while 26 to 74 describe a mixed market.
The comparison uses percentage returns, not token prices. A coin trading at a lower price than Bitcoin isn't automatically cheaper or performing better. What matters is how its price changed over the same measurement window.
The diagram separates the asset universe from the outperformance requirement.
Read the Math Before the Label
Calculate each asset's return as:
Return = (ending price ÷ starting price − one) × one hundred
Then compare each eligible coin's return with Bitcoin's return over identical dates. Count the assets that beat Bitcoin, divide that count by the eligible universe, and express the result as a percentage. That final share measures breadth, meaning how widely outperformance is distributed.
This distinction prevents a common mistake. If several meme coins surge but most eligible assets lag Bitcoin, those winners don't establish a broad altcoin season. They're evidence of localized strength.
- Relative performance isn't an absolute gain. An altcoin can outperform Bitcoin while both lose value, provided the altcoin declines less.
- The window matters. A recent reversal may not immediately change a rolling index because earlier performance remains in the calculation.
- The universe matters. Check a provider's eligible assets and exclusions before comparing its reading with another dashboard.
Practical rule: Treat the index as a description of market participation, not permission to buy an unexamined token.
For a trade decision, a qualifying reading can support researching broader altcoin exposure. A mixed reading calls for greater selectivity. Neither tells you your entry price is attractive, your exit will remain liquid, or your particular coin will keep outperforming.
Bitcoin Dominance and the Macro Rotation
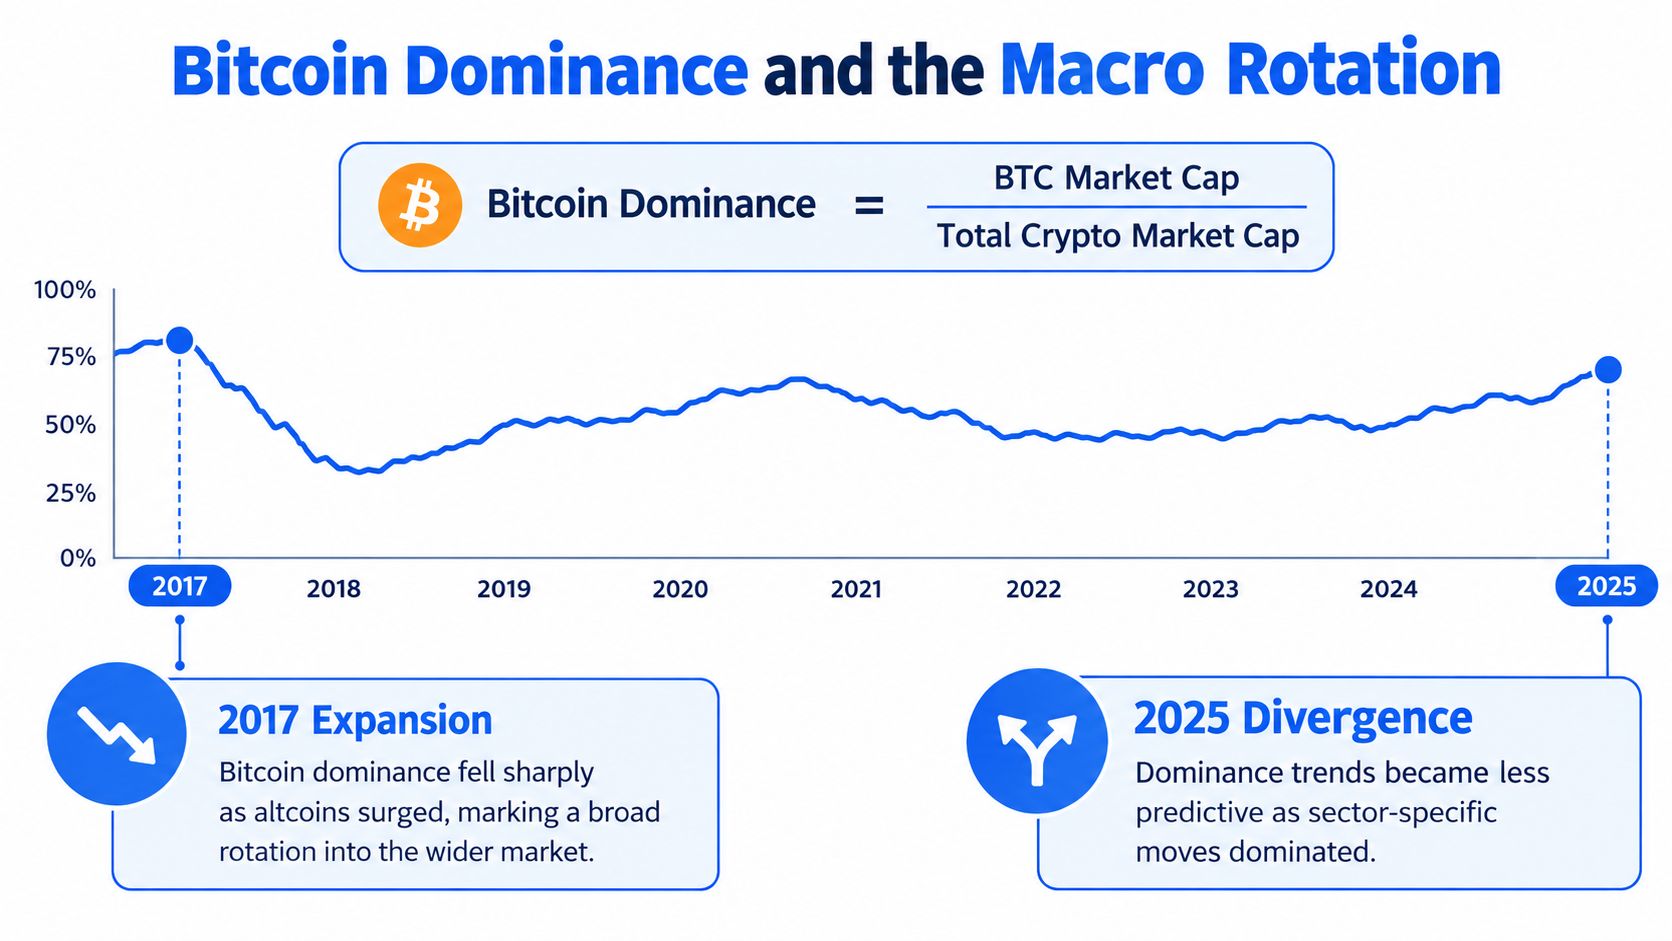
Bitcoin dominance measures Bitcoin's share of total cryptocurrency market capitalization. Unlike the altcoin-season index, it doesn't count how many individual assets outperform.
The calculation is straightforward:
Bitcoin dominance = Bitcoin market capitalization ÷ total cryptocurrency market capitalization × one hundred
Market capitalization itself is price multiplied by circulating supply. The denominator aggregates the assets included by the data provider, so changes in coverage and token supply deserve attention alongside price movements.
The timeline illustrates the difference between a broad historical rotation and a more fragmented market.
What the Historical Swings Show
The historical episodes described in Crypto.news's Bitcoin dominance explainer put dominance near 96% on March 1, 2017, and approximately 36% by January 5, 2018, a decline of about 60 percentage points; the later cycle moved from roughly 70% in January 2021 toward 39% over the following five months.
Those episodes help explain why traders watch falling dominance for evidence of rotation. Altcoins accounted for a larger share of the market as their relative strength increased. But percentage points and percentage returns aren't interchangeable: subtracting dominance readings measures a change in market share, not a portfolio gain.
More importantly, dominance is a ratio. Its direction alone doesn't reveal whether buyers are committing fresh capital to altcoins or whether Bitcoin is weakening.
| Dominance pattern | Interpretation to test | Trading implication |
|---|---|---|
| Falling while altcoin prices strengthen | Possible rotation toward altcoins | Investigate breadth before expanding exposure |
| Falling while prices decline broadly | Relative weakness, not necessarily attractive conditions | Examine drawdowns before adding risk |
| Falling as token capitalization expands | Supply or coverage may influence the denominator | Check whether established assets also participate |
Pair Market Share With Participation
A useful macro reading asks whether the dominance trend agrees with actual altcoin returns. If it doesn't, avoid turning a chart pattern into a confident rotation narrative.
For a newcomer, the concrete decision is whether to broaden the watchlist, not whether to buy everything outside Bitcoin. Market share can identify a change worth investigating. Breadth determines whether that change extends beyond a narrow cluster of winners.
For a visual companion to the dominance calculation, the embedded video is below.
The Signals Traders Actually Watch
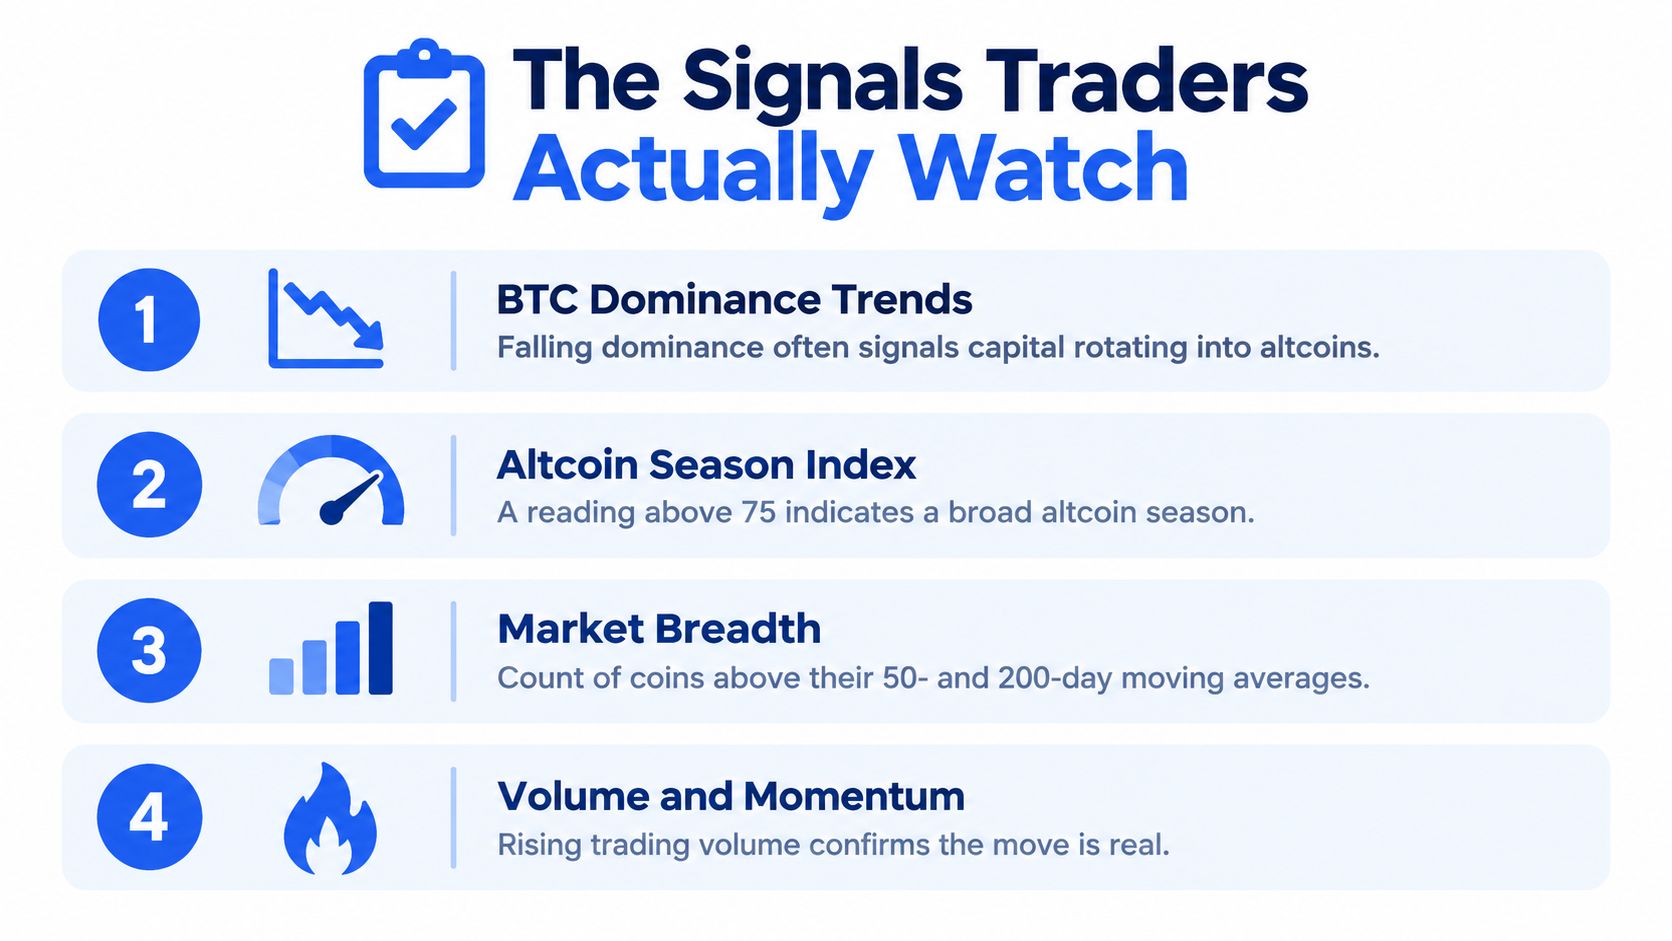
A useful trading checklist assigns each signal a specific job. Dominance describes market share, the index summarizes relative participation, and sector analysis tells you where to investigate opportunities.
Don't demand that every indicator look bullish. Instead, ask whether the evidence supports the trade you're considering and what observation would contradict it.
The checklist below is a starting point, not an automatic entry system.
Give Each Signal a Reading Rule
- BTC dominance trend. Use a sustained decline as a reason to investigate rotation. Withhold confirmation if altcoin prices and participation don't support that interpretation.
- Altcoin Season Index. Read the classification as evidence about the completed measurement window. Don't assume a favorable reading identifies an early entry.
- Trend breadth. Count eligible assets trading above short- and long-term moving averages. Expanding participation is more persuasive than a rally concentrated in the largest names.
- Sector leadership. Compare majors, mid-cap assets, and meme coins separately. If only one group improves, focus research there rather than extrapolating to the entire market.
A moving average is the mean closing price over a chosen lookback. To calculate trend breadth, divide the number of assets above that average by the number examined. Keep the universe and lookback consistent, otherwise changes in your sample can masquerade as changes in market conditions.
Separate Funding Conditions From Token Evidence
Stablecoin liquidity is worth monitoring as potential purchasing capacity, but available stablecoins aren't proof that traders will buy your sector. Look for actual deployment alongside availability.
Exchange inflows also require context. An incoming transfer doesn't tell you whether its owner intends to sell, provide collateral, or move assets between accounts. Treat a flow as a prompt for investigation rather than an instruction.
Funding rates belong to derivatives analysis, not strictly on-chain analysis. They describe periodic payments between long and short positions. Use them to examine positioning pressure, then assess whether the underlying spot trade still makes sense.
A Solana meme-coin market radar can help organize the sector watchlist. It shouldn't replace inspection of the token's own trading conditions.
Rising reported volume is a reason to inspect trades, not proof that the move is genuine.
For execution, compare wallet activity, trade sizes, liquidity availability, and selling conditions. If price momentum looks strong but the evidence behind it is inconsistent, keep the candidate on your watchlist rather than forcing an entry.
Sector Rotation vs Broad Altcoin Season
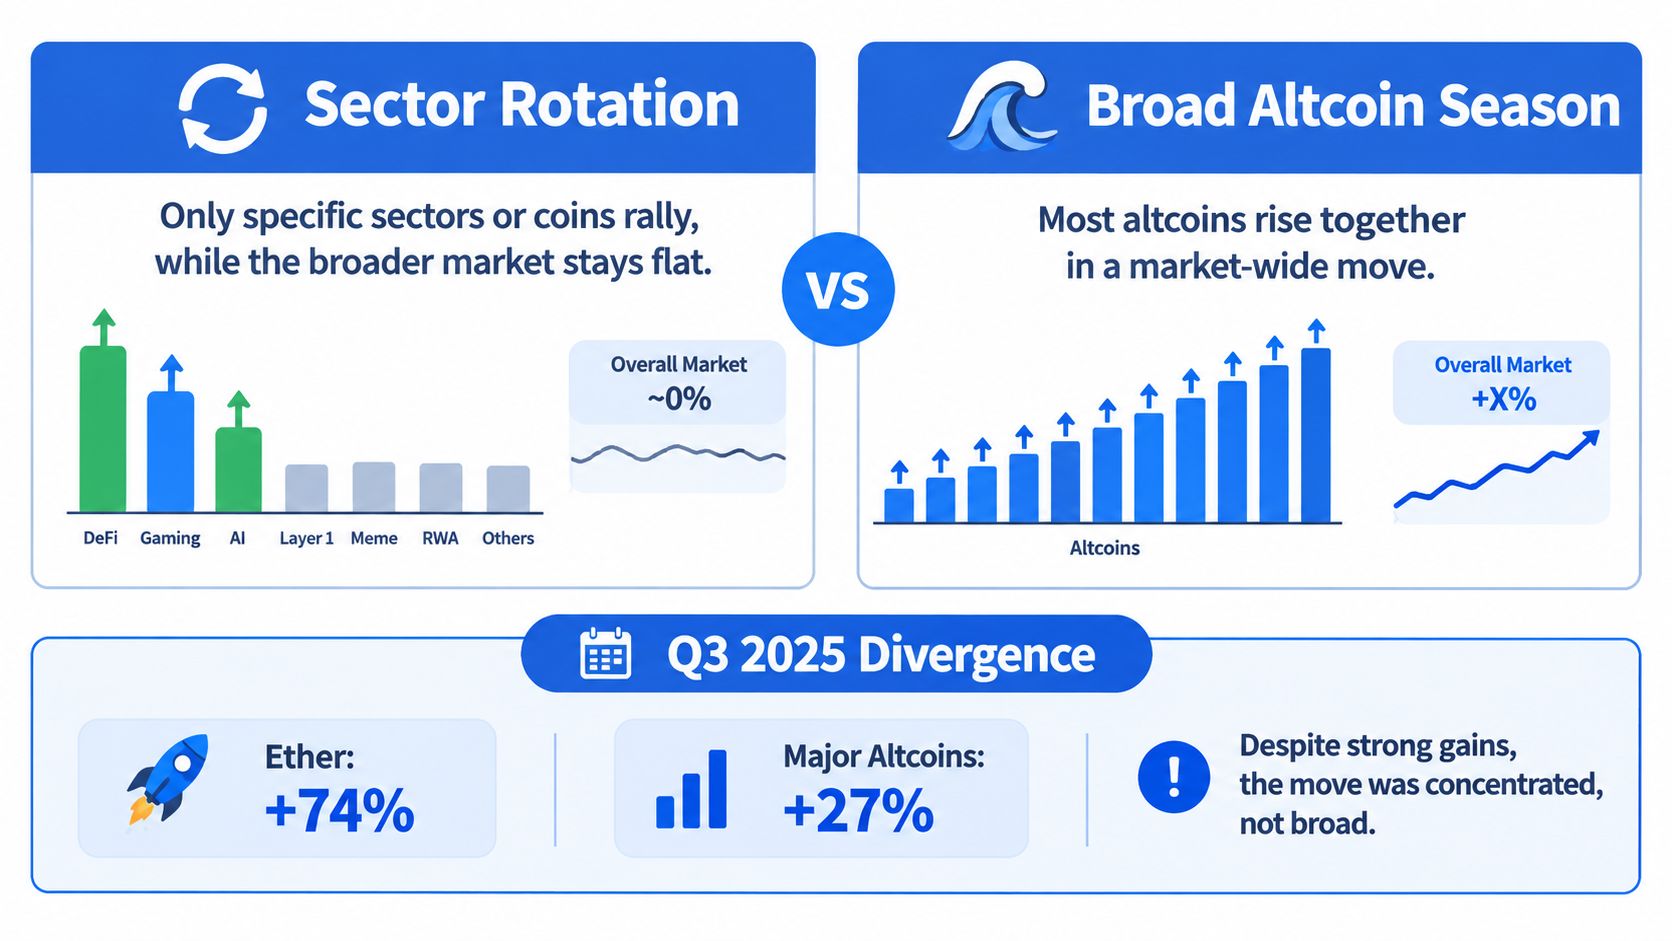
A trader holding a leading sector can experience a very different market from someone holding a broad altcoin basket. Both can describe their portfolios accurately while reaching opposite conclusions about whether altcoin season has arrived.
The divergence discussed in CoinMarketCap's explanation of delayed altseason includes Ether reportedly gaining 74% in Q3 2025 and major altcoins gaining more than 27%, while Bitcoin remained the primary institutional allocation benchmark; it also describes Bitcoin dominance moving from 65% to 59% during 2025, characterized as the first sustained rotation into altcoins since early 2021.
Those observations establish uneven performance and a reported rotation. They don't, by themselves, establish that the breadth threshold was met across the eligible market.
The comparison illustrates why sector leadership and broad participation need separate labels.
Compare the Typical Coin With the Largest Coins
A market-cap-weighted return assigns more influence to larger assets. Calculate it by multiplying each asset's return by its share of the basket's total market capitalization, then adding the results.
An equal-weighted return gives every selected asset the same influence. Add their percentage returns and divide by the number of assets.
These measures answer different questions. A strong market-cap-weighted basket with a weak equal-weighted basket suggests that larger constituents are doing more of the work. Strong results across both are more consistent with distributed participation, although neither replaces the index's direct outperformance count.
For a trader, that difference affects selection. Leadership concentrated in established assets doesn't justify buying newly issued tokens because they belong to the same chain.
Your Sector Needs Its Own Comparison
Solana is a chain, while meme coins are a token category. A rally in Solana's native asset doesn't automatically establish strength across its meme coins, and a busy meme-coin launch market doesn't establish strength across established Solana tokens.
Use Solana meme-coin narratives to organize thematic research, then test each theme against comparable assets. Mixing liquid, established tokens with fresh launches can produce a misleading picture of what a typical tradable candidate is doing.
- Define the group. Compare assets with similar maturity and trading conditions.
- Inspect the distribution. Identify whether many constituents contribute or whether a few winners dominate.
- Test the candidate. Require its own relative strength and execution evidence.
The concrete decision is whether you have a sector trade or a broad-market allocation thesis. A sector trade needs evidence within that sector and an exit tied to its conditions. Calling it altcoin season doesn't make the opportunity broader or the token safer.
When the Old Signals Stop Working
A strong cryptocurrency market doesn't have to produce a classic altcoin season. Investors can favor Bitcoin while selected altcoin sectors rally, leaving broad outperformance incomplete.
The Crypto.news account of the Coinbase and Glassnode investor survey reports that 39% of institutions and 40% of independent investors expected Bitcoin dominance to remain between 55% and 60% over the following three to six months, while only 38% of institutions expected altcoins to perform best.
Those figures describe expectations, not realized returns. They show why you shouldn't assume investors anticipate an automatic handoff from Bitcoin to the rest of the market.
Distinguish Expectations From Confirmation
An ETF- and institution-influenced market raises a practical question: are investors buying broad crypto exposure or a specific asset through a particular channel? The answer matters more than a familiar cycle diagram.
It's too strong to declare dominance obsolete. The calculation still describes market share. What deserves skepticism is the assumption that the same dominance pattern always produces the same subsequent rotation.
| Apparent signal | Evidence needed before acting |
|---|---|
| Selected altcoins rally | Participation beyond the leading sector |
| Dominance declines | Absolute returns alongside relative returns |
| New purchasing capacity appears | Deployment into the assets you're tracking |
| Speculative activity accelerates | Durable liquidity and credible trading activity |
A retrospective index can also remain favorable after current trading conditions deteriorate. That's a limitation of using a rolling historical window for a forward-looking decision, not necessarily a flaw in the calculation.
Use More Than One Horizon
Compare the index window with shorter-term price behavior and the holding period you intend. A swing trader shouldn't ignore a recent breakdown because a longer historical comparison still looks healthy.
Examine drawdown, the decline from a previous peak, as well as return. Two candidates can have similar net performance but very different paths, and that difference can affect whether you could realistically hold the position.
Invalidation test: If the trade requires broad participation but only a narrow sector remains strong, reduce the thesis to what the evidence actually supports.
A trader can participate in an isolated rally without calling it broad altcoin season. The discipline is to define the opportunity narrowly, avoid assuming unrelated tokens will follow, and change exposure when the observations supporting the trade disappear.
Why Solana Meme-Coin Rallies Cut Both Ways
A Solana meme coin appears on your watchlist during a sector rally. Its chart rises, reported volume grows, and traders begin discussing it. None of those observations answers the question that matters before entry: can you buy and later sell under conditions you understand?
A useful pre-trade review follows the token address rather than its ticker. Names and screenshots aren't substitutes for inspecting the asset you'll transact with.
Follow the Evidence Behind the Chart
Start with liquidity, meaning the trading capacity available to absorb purchases and sales. Inspect the relevant pools and test a quote for your intended transaction. A small quote isn't enough if you're considering a materially larger position.
Next, examine holder distribution. Separate pool addresses and identifiable operational accounts from wallets that may represent concentrated discretionary ownership. If several large holders could materially affect your exit, that belongs in the decision before you buy.
- Creator behavior. Review creator-linked transactions and available history. Unexplained transfers or disposal activity warrant investigation.
- Bundle and insider activity. Look for coordinated acquisition or related-wallet patterns. Apparent wallet diversity may not mean independent ownership.
- Trading quality. Compare reported activity with actual swaps and counterparties. Repeated activity among related wallets shouldn't be treated as independent demand.
- Historical risk indicators. Check relevant prior behavior, while distinguishing documented evidence from an inferred connection.
These checks aren't interchangeable. Good liquidity doesn't resolve concentrated ownership, and a clean creator history doesn't establish that current trading activity is credible.
Turn Findings Into an Entry Decision
Suppose the sector remains strong but your candidate's major holders are transferring tokens toward venues where they could sell. You don't need to predict their intentions with certainty. You need to decide whether the unresolved exposure is compatible with your planned position.
A different candidate may show less exciting momentum but clearer ownership and more workable execution. That doesn't make it a guaranteed winner. It gives you a more interpretable trade.
Use a live on-chain report to gather evidence at the moment of analysis, then read the underlying checks rather than relying on a headline rating. A score compresses information; the explanation should show which observations produced it and where uncertainty remains.
A favorable macro backdrop can't compensate for an exit you haven't tested.
Recheck material conditions before execution, especially if your earlier review preceded significant trading activity. If ownership, liquidity, or creator behavior no longer matches your thesis, passing on the token is a valid outcome. The purpose of screening isn't to manufacture confidence in every candidate.
A Practical Playbook for the Rotation
Begin with a written thesis: are you trading broad altcoin participation, a particular sector, or a token-specific setup? Choose the relevant evidence before choosing the position size.
Then move from market context to execution. The sequence below keeps a persuasive macro story from substituting for a token review.
Match the Signal to the Next Check
Macro Signal vs Token-Level Check
| Macro Signal | What It Tells You | Token-Level Check That Should Follow |
|---|---|---|
| Favorable index classification | Broad historical relative participation | Verify the candidate's current setup |
| Declining BTC dominance | Changing market-capitalization share | Test liquidity for your intended order |
| Strength in a meme-coin sector | A narrower research opportunity | Inspect holder concentration and related wallets |
| Expanding trading activity | Greater apparent interest | Review swaps, counterparties, and creator behavior |
Once the candidate passes review, define what would make the trade wrong. An invalidation level can be price-based, but changes in liquidity or ownership can also invalidate a setup before price reaches your planned exit.
Set the maximum loss you can accept, then relate position size to the distance between entry and invalidation. Allow for execution costs and slippage. For thinly traded tokens, don't assume a stop order guarantees that maximum loss.
Plan the Exit Before Entry
- Cap exposure. Decide the maximum allocation before enthusiasm changes your judgment.
- Enter incrementally. Add only when the evidence remains consistent with the thesis.
- Write the exit conditions. Specify what prompts profit-taking, reduction, or abandonment.
- Review execution. Check whether your intended sale is still practical as conditions change.
Use a guide to when to sell Solana meme coins to turn general caution into a concrete exit plan. Don't build a strategy that depends on identifying the exact top.
Altcoin season is a context for taking risk, not a substitute for checking what you're buying. The best outcome of your workflow may be a well-defined trade, a smaller position, or no trade at all.
MemeAssist generates on-demand Solana token reports from live on-chain and market data, combining an Overall Health Score, Rug Risk Rating, plain-English AI Verdict, and Detailed Risk Breakdown. Before turning an altcoin-season thesis into a meme-coin position, visit MemeAssist to examine liquidity, holder concentration, creator behavior, and trading-pattern evidence for your candidate.