Best Meme Coins to Buy: A Safety-First Checklist for 2026
Shiba Inu's market capitalization grew from about $1.28 million in March 2021 to roughly $51.4 billion at its all-time high, a rise of around 39,000 times from that starting figure, according to CoinMarketCap's Shiba Inu timeline. That extraordinary move made SHIB a major speculative asset, but it didn't prove that its price could hold or that every buyer could exit at a favorable price. For those looking for the best meme coins to buy, that distinction matters: a spectacular chart is not the same as a survivable trade.
Table of Contents
- Why Hype Rankings Miss the Real Risk
- Signal Checklist and Five-Step Screen
- Reading the First 15 Minutes of Trades
- Using MemeAssist to Check a Token Faster
- Ranking Survivors and Planning the Exit
- Recheck Your Thesis Before Every Buy
Why Hype Rankings Miss the Real Risk
Dogecoin began 2021 near $0.00468 and by May 5 had risen more than 14,000% for the year, reached a market capitalization of roughly $88 billion, and ranked as the fourth-largest cryptocurrency after a 40% single-day surge, according to Reuters' May 5 report on the surge. Greater liquidity can make entry and exit easier than a thin token allows, so size alone is not the problem. Market size still does not prevent severe drawdowns, and a fast rise can leave sentiment-driven demand already priced in.
A ranking built from last week's returns identifies which tokens have attracted attention. It does not show whether the pool has enough depth for your position, whether top wallets are connected, or whether the creator is selling into the move. Those questions decide whether a trade is survivable. A meme coin has no earnings anchor. Its price depends on attention, access, holder behavior, and new buyers continuing to participate. You can lose everything you put in, even if nobody pulls the rug. Demand can fade while liquidity and price deteriorate together.
The practical question: Can you enter and exit without becoming someone else's exit liquidity?
That question turns "best" into a test of survivability, not a return forecast. The useful screen is a repeatable recheck, not a one-time verdict. Before every buy, confirm that liquidity, holder concentration, linked wallets, buyer activity, early trade behavior, mint and freeze authority, and volume persistence still support the thesis you wrote down. A token that passed yesterday can fail today when holders move, liquidity changes, or the creator's wallet starts selling.
Signal Checklist and Five-Step Screen
The screen below answers one practical question: if you buy, who buys after you? That makes survivability and exit liquidity the first filters. A token with exciting volume but no depth for your size is a trap, not an opportunity. Use the table as a pass/fail sheet, write down each result, then run the five steps in order on the same token. Set your limits before you review candidates so a green chart cannot talk you out of them.
| Signal | What to Check | Red Flag |
|---|---|---|
| Executable liquidity | Depth compared with your intended position size | Liquidity that thins sharply on a small sell |
| Holder concentration | Top-10 and top-20 share, excluding burn and liquidity-lock addresses | A few wallets controlling most of the supply |
| Creator and early-funder wallets | Whether they link to each other or to top holders | Coordinated wallets funded from one source |
| Unique buyers vs total transactions | Ratio of distinct buyers to all trades | Heavy transaction counts with few real buyers |
| Early buy and sell balance | Buy/sell imbalance and trade size in the first 5–15 minutes | Many small buys followed by large coordinated sells |
| Mint and freeze authority | Whether the creator still controls minting or freezing | Authority still held by the creator |
| Volume persistence | Whether volume holds after the launch spike | Volume that collapses within hours of the spike |
No single threshold turns a meme coin into a safe buy. A consistent rule does make it harder to rationalize warning signs because the chart is moving.
Test exit liquidity first. Compare pool depth and likely price impact with the size you intend to trade. Headline volume can mislead: a token may trade frequently while still being hard to sell without moving its price. Solidus Labs' 2025 Rug Pull Report found that about 98.6% of more than 7 million tokens deployed on Pump.fun between January 2024 and March 2025 failed to maintain at least $1,000 in pool liquidity, leaving about 97,000 above that threshold, according to the report on Solana rug pulls and pump-and-dump activity. I treat thin liquidity as a rejection. Faster execution will not fix an exit that is not there.
Measure holder concentration. Calculate the top-10 and top-20 shares, excluding clearly identified burn and liquidity-lock addresses. A high share does not prove those wallets will sell, but it tells you a small group may have substantial influence over the market.
Map connected wallets. Trace the creator and early funders, then check whether they link to top holders. Wallet clustering matters because several addresses can represent one coordinated seller rather than independent buyers.
Compare buyers with trades. A high transaction count means less when a small number of wallets generate most of the activity. One large-scale study of more than 2 million tokens found that 1.7% had been actively traded in the preceding 30 days, while 3.59% displayed patterns potentially linked to pump-and-dump activity, as described in the study of token trading and suspicious activity.
Repeat the checks after material changes. A screen is a snapshot, not a verdict. Recheck when liquidity shifts, holders change, or trading behavior breaks from the pattern you logged. Confirm mint and freeze controls through Solana token safety checks, then compare the new result with your log. Reject the token if the warning signs have moved in the wrong direction. The useful ranking is the one that favors survivability and clean exit conditions over the biggest recent gain.
Reading the First 15 Minutes of Trades
A steep early rise doesn't prove a token has genuine demand. Fast price movement can be part of coordinated promotion, and an early buyer may be buying into a wave that's already setting up to sell. Research on cryptocurrency pump-and-dump schemes found that 10% of Telegram-coordinated pumps increased in price by more than 18% in five minutes. The same study reported median spikes of roughly 3.5–4.8% for larger-cap assets and about 19–23% for coins ranked below 500, as described in the academic research on pump-and-dump schemes. Sharp early returns are a reason to investigate, not evidence of quality.
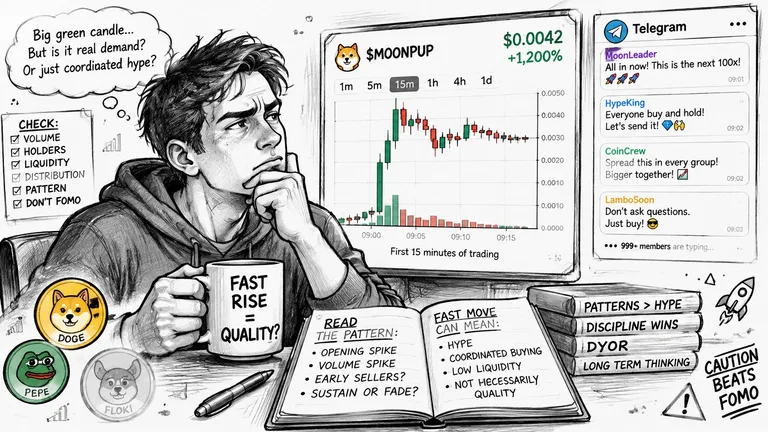
Pull the first 5–15 minutes of swaps and read wallet behavior, not the candles. That means buy/sell imbalance measured in SOL rather than trade count, median trade size, unique wallets against total trades, repeated interactions between the same addresses, price impact per fill, and how liquidity depth changes after each trade. Volume that grows without a matching rise in unique holders, addresses that keep reappearing on both sides of the book, and clusters of small buys followed by large coordinated sells are the patterns worth flagging. A high trade count means little when a dozen wallets produced most of it.
Test the exit before you test the entry. Sell pressure in the opening minutes says more about survivability than a green chart does. Check the price impact of a sell roughly the size of your intended position, and watch whether liquidity stays in the pool after the first wave of buyers. Thin, pullable liquidity is a reason to pass, not a problem to solve with faster clicks.
Stage the entry. Watch first, and treat the opening candle as noise until liquidity holds and sells clear without severe impact. Size the position so a full exit at available depth wouldn't materially damage your portfolio, then recheck creator-linked wallets and top holders before adding, because the initial read ages quickly.
A passing metric can also mislead. Reaching a launchpad graduation milestone doesn't show that trading is organic or that a token is safe. Wash trading can push a token across that threshold while real demand stays absent, so graduation measures a line being crossed, not the quality of the buyers behind it.
A token can look clean for 15 minutes and still fail. Buys climb, volume looks healthy, and the wallet list barely changes. Waiting is a valid trade decision. No early signal guarantees a safe exit, and coordinated selling or liquidity removal can still overwhelm a promising-looking chart.
Using MemeAssist to Check a Token Faster
A token report can speed up screening, but it can't replace your own review of the underlying signals. MemeAssist analyzes Solana tokens using live on-chain and market data, bringing several kinds of evidence together so you can make a faster, more informed assessment.
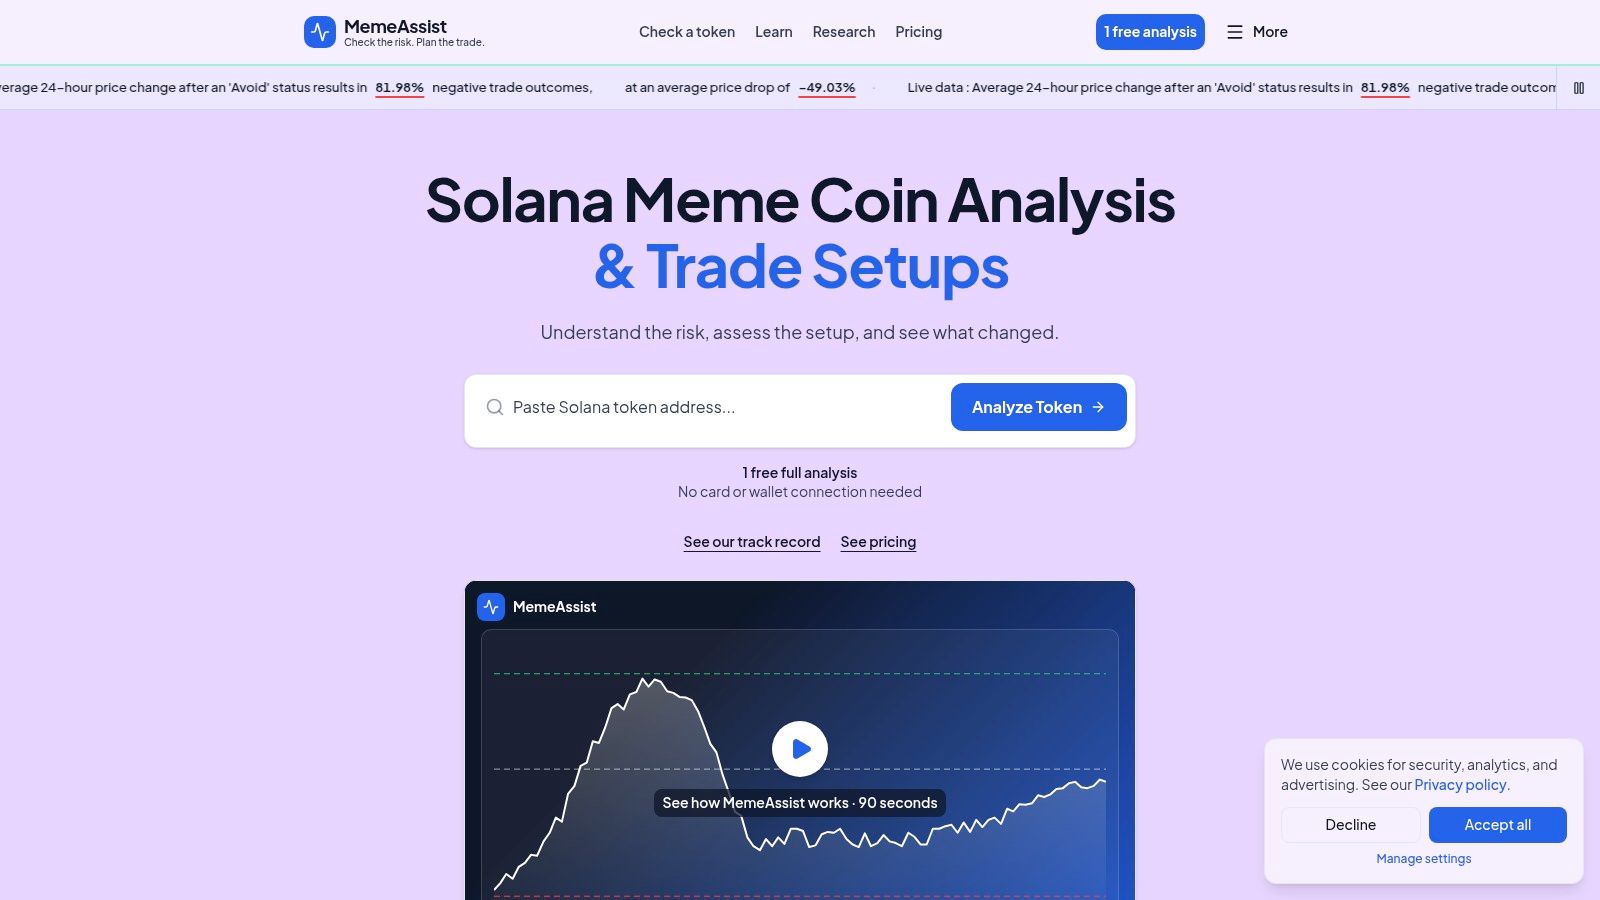
An on-demand report gives you four outputs:
- Overall Health Score: A concise view of the token's assessed condition.
- Rug Risk Rating: A separate assessment of potential rug-pull risk.
- AI Verdict: A plain-English interpretation of the signals.
- Detailed Risk Breakdown: Supporting checks and explanations you can compare with your own findings.
The report draws on six evidence categories: liquidity; holder distribution and concentration; creator behavior; wallet activity; trading patterns, including bundle and insider detection; and historical risk indicators. The analysis also checks mint and freeze authorities. Its holder review looks at concentration and whether the available data suggests connections among wallets. For a more detailed explanation of the method, see how MemeAssist analyzes Solana tokens.
Use the output as a way to organize your checklist, not as a substitute for it. Match each risk breakdown item to a row in your own log: does the report's liquidity assessment reflect the amount you plan to trade? Does the holder review account for likely connected wallets? Do the trading signals fit what you see in recent swaps? If the AI Verdict disagrees with your read, return to the raw signals and resolve the discrepancy before buying.
A complete report may also include a Trade Setup with entry levels, stops, and targets, but only when the token's price structure supports a conditional scenario. Compare any suggested setup with your own liquidity and execution measurements before using its levels. A price level on a screen won't guarantee that you can sell at that price in a thin or rapidly changing market.
New users get one free full analysis; after that, the service charges per action with no subscription. MemeAssist's reports combine visual indicators, token health and rug-pull risk assessments, supporting evidence, and plain-language explanations. Treat the report as a second opinion for research, not a guarantee that a token is safe.
Ranking Survivors and Planning the Exit
Once candidates have passed your screen, rank them by how cleanly you could get out, not by how far their prices have already run. A token with a quieter chart but deeper exit liquidity and less concentrated ownership may be easier to manage than a sudden momentum leader.
Apply a hard rejection rule. Drop any candidate with live mint or freeze authority, or with creator-linked wallets controlling a visible share, before you score the rest. These conditions can give an insider more influence over the token or its trading environment.
Score the survivors using your recorded checks. Compare exit depth at your intended size, top-10 and top-20 holder concentration, unique buyers against total transactions, early buy/sell behavior, and volume persistence after the launch spike. Use the same measures for each token, rather than letting a compelling narrative change the criteria.
Set your limits before looking at candidates. Choose the liquidity, concentration, and activity levels you'll accept, then record them. The available evidence doesn't establish a universal cutoff, so a threshold picked after you've fallen in love with a token can become an excuse rather than a rule.
Rank by execution quality. A sharp return is a prompt to recheck liquidity and wallet behavior, not a reason to move a token up your list. Keep the ranking log beside the screening log so you can compare your decision with what changes during later checks.
Plan the exit before entry. Set a maximum position size based on whether available liquidity can support a full exit. Write down what liquidity drop would trigger a partial sale and what change in holder or trading behavior would end the position. For more on choosing an exit approach, see how take-profit orders compare with trailing stops for memecoins.
If you use a Trade Setup, check that its liquidity assumptions match your own measurements before considering its levels. A ranking is only useful if it helps you make a decision in advance, before emotion and price movement start rewriting your rules.
Recheck Your Thesis Before Every Buy
A clean-looking token can change after a liquidity event, a new holder cluster, or a shift in creator behavior. A Solana study identified freeze-authority abuse, liquidity withdrawal, and pump-and-dump behavior as recurring rug-pull patterns. In a sample of 100,063 tokens issued during the first half of 2025, its behavior-guided detection pipeline classified 76,469 as rug pulls, according to the Solana rug-pull study. That finding describes the study's sample and method. It isn't a universal probability that any individual token will be a rug pull.
The key point is that risk can appear as a sequence of actions, rather than as one static property visible at launch. Monitor for insider selling, creator-wallet activity, shrinking liquidity, wash-like trading, and a rapid rise in concentration. A renounced authority or initial liquidity lock may answer one question, but neither tells you whether the token's broader trading conditions have changed.
Nor can a token pass every check and thereby eliminate market risk. A token can still collapse when demand disappears, large holders sell, liquidity changes, or new information appears. A screening result is a snapshot, not a guarantee that other buyers will remain or that you'll be able to exit at your preferred price.
Build a time-based routine around that fact:
- Before buying, write down the evidence that would invalidate your thesis within the next 24 hours. Make the triggers observable, such as a material liquidity decline, creator-linked selling, or a sudden concentration shift.
- After entry, repeat the check at 24 hours and after any meaningful liquidity or holder change. Don't wait for the scheduled review if a warning sign appears sooner.
- Keep a change log. Record what changed, when it changed, and whether it affected your decision to hold, reduce, or exit. That creates a record of your actual process, rather than a post hoc explanation built around the price chart.
A token's current risk verdict can only describe the evidence available at the time of the check. Reassess before adding to a position, not just before opening one. What evidence would invalidate today's bullish thesis within the next 24 hours?
MemeAssist provides on-demand Solana token analyses that bring live market and on-chain signals into a plain-English risk report. Use it as a second opinion alongside your liquidity, holder, and trading checks, then visit MemeAssist to analyze a token before your next buy.
Topics: meme coins, meme coin safety, Solana meme coins, rug pull signs, token safety checks
Informational only, not financial advice. Meme coins are extremely high-risk.
All articles