10 Blockchain Analytics Tools Compared for 2026
Most roundups of blockchain analytics tools rank products by how many charts, chains, or widgets they ship. That advice fails the decision in front of you. You need to know who holds a token, how money moved, whether liquidity can be pulled, or what a dataset can and cannot show. A busier dashboard does not answer those questions.
Scale is why "just click around the explorer" also fails. Reporting on Chainalysis's 2024 Crypto Crime Report said identified illicit addresses received approximately $24.2 billion in cryptocurrency during 2023, equal to 0.34% of total on-chain transaction volume, down from roughly 0.42% in 2022. Sanctioned entities and jurisdictions accounted for $14.9 billion, or 61.5%, of 2023 illicit transaction volume, according to that Bits of Blocks write-up of the Chainalysis report. Legitimate flow can outgrow known illicit flow, and you can still lose a position in one pool.
I group the ten tools below by job, not by feature count. Trading screens, holder investigations, and market or compliance context are different tasks. I also separate data platforms from purpose-built safety checkers, so you don't expect a risk verdict from a SQL workspace or a TVL chart. Each entry states where I would not use that tool. A dashboard is a starting point. Labels, clusters, and scores are leads.
Table of Contents
- 1. MemeAssist
- 2. Birdeye
- 3. Bubblemaps
- 4. Nansen
- 5. Dune
- 6. Arkham
- 7. DeFiLlama
- 8. Token Terminal
- 9. Glassnode
- 10. Santiment
- How the Ten Tools Compare on Use Case, Chain Coverage and Pricing
- Building a Stack That Matches the Job
1. MemeAssist
A Solana meme-coin risk check needs more than a price chart. MemeAssist is a purpose-built AI risk analysis tool for Solana tokens. Enter a token address to get an Overall Health Score, Rug Risk Rating, plain-English AI Verdict, and Detailed Risk Breakdown, based on live on-chain and market data.
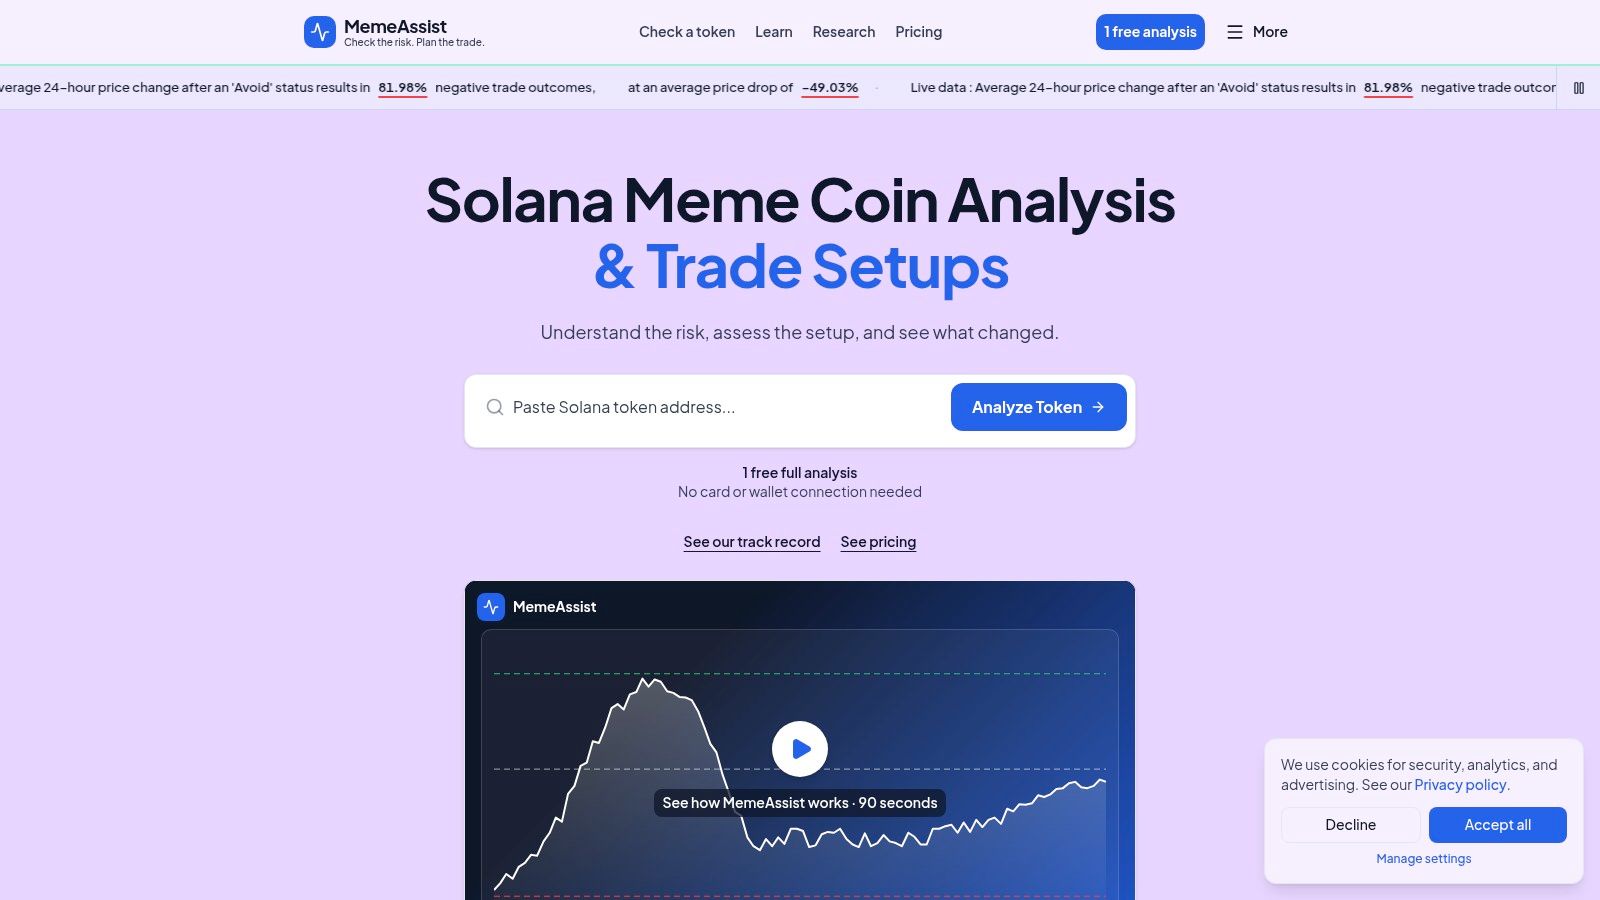
The analysis covers liquidity, holder distribution, creator behaviour, wallet activity, trading patterns, and historical risk indicators. Checks include mint and freeze authorities, token concentration and possible wallet connections, as well as activity that may warrant a closer look, such as bundle or insider patterns. These are signals to investigate, not proof of misconduct. Missing data is not evidence of safety.
What you should not treat as a buy signal
A full analysis includes a conditional Trade Setup when the available data supports one. It summarizes risk and opportunity context; it does not force entry, stop, or target levels onto an unclear price structure. Eligible new users can start with one free full analysis, then use prepaid pay-as-you-go credit without a recurring subscription. Free scanners and charts suit users who prefer to gather and interpret data themselves; the full report explains the evidence behind its scores and verdict. MemeAssist has analyzed 20,000+ tokens.
Practical rule: Check when the decisive evidence appeared and whether risk is rising, steady, or already realized. A favorable score is a research signal, not permission to approve a wallet prompt.
MemeAssist is designed for Solana, not Ethereum, Base, or other chains. Its AI can misinterpret information, and blockchain or market data may be incomplete, delayed, or unavailable. The analysis cannot guarantee safety or profits. Flagged tokens can be tracked for 24 hours, with outcomes used to support ongoing tool calibration, not to predict the next mint.
2. Birdeye
Say you are watching a Solana pool and you need price, trades, and a security panel before you chase wallet clusters. That job is market screening. Birdeye is a data platform with strong Solana coverage, not a purpose-built safety checker.
You get real-time prices, charts, OHLCV, and trade prints, plus holder, market, and liquidity context in its token-security views. Wallet analytics and token discovery sit next to the chart, which is why active DEX traders can stay in one product. REST and streaming APIs matter when a bot or internal watchlist should see the same tape as the website.
- Fast tape: Price, liquidity, and trades update where you screen new pairs.
- Builder path: Data APIs support automated workflows instead of manual refreshes.
- Solana fit: Coverage matches meme-coin and DEX flow better than a Bitcoin-only macro suite.
I would not treat a security score here as proof a token is safe. Broad market data also will not show whether several wallets are one actor. Some features and API capacity may require paid access. Use Birdeye to read the market. Hand the rug question to a checker that lays out liquidity, creator history, and holders in one explained report.
3. Bubblemaps
Holder lists lie by being boring. Fifty wallets can be one funding path, and a spreadsheet rarely makes that obvious. Bubblemaps is an investigation tool. It draws token holders and wallet links as maps, including on Solana and other networks. It is not a safety checker and it will not score liquidity, mint authority, or trade quality for you.
A peer-reviewed study in Financial Innovation clustered 105,589,345 Bitcoin transactions from blocks 610,000 through 660,000, mined from December 27, 2019, to December 5, 2020. Most transfers fell in a common-user cluster. The method's value was grouping behavior, not declaring fraud. The same limit applies to a bubble map. A visual tie is a lead, not proof of common control.
APIs and iframe embeds suit platforms that want the map inside their own page. Pricing is aimed at builders, not at someone running one casual check. I use the map as a second pass after a chart or explorer, then I read how holder maps should be interpreted before I treat two bubbles as one person. Do not use it alone to decide whether liquidity can be pulled.
4. Nansen
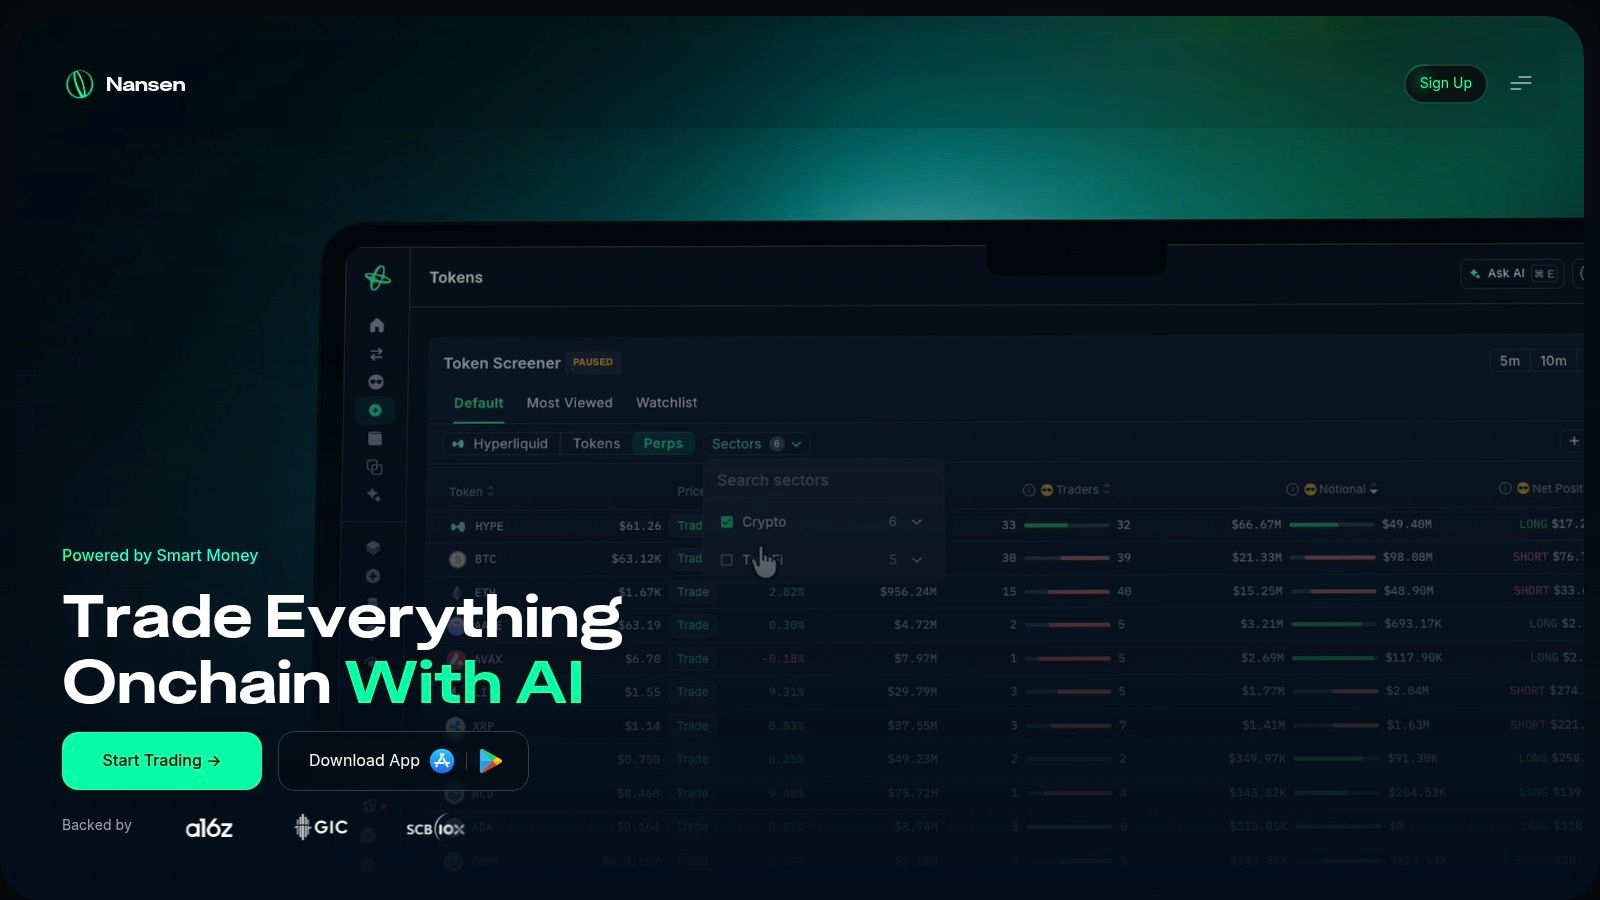
If the question is who is active around a token, labels beat a raw address list. Nansen is a data platform for wallet labeling and on-chain behavior, not a purpose-built Solana safety verdict.
Solana token and holder research, wallet profiles, PnL, and Smart Money tracking are available to registered users without a paid plan. Paid plans add broader multi-chain analytics, alerts, and deeper access. That split is useful. You can see whether labeled wallets are buying, selling, or sitting, then decide if the tape matches the story on the chart.
Labels are interpretations. A "smart money" tag can be stale, narrow, or wrong for a two-minute meme. I verify the underlying transfers before I copy a wallet. Advanced features and API access are gated, so a casual screen and a production bot are not the same product. It also will not tell you, by itself, whether the creator can mint or whether the pool can vanish.
A leaderboard is a research shortcut. It is not a substitute for checking the token's own controls.
For the Solana version of that habit, tracking labeled wallets belongs next to holder and liquidity evidence, not instead of it. I would not use Nansen as the only pass before a buy.
5. Dune
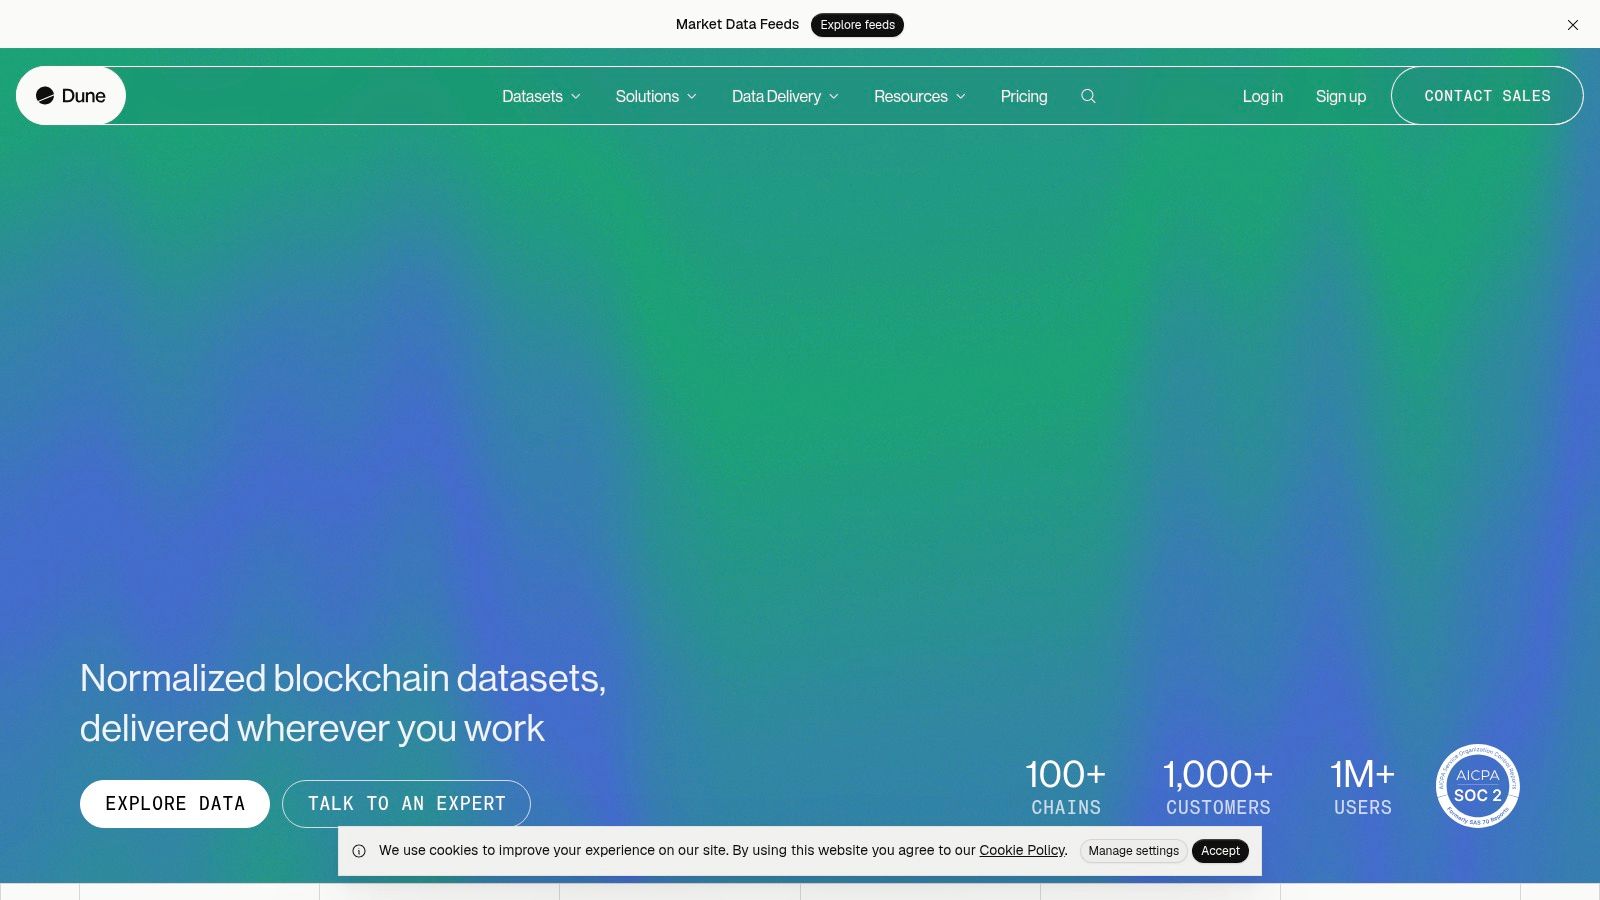
Custom questions are Dune's job. It is a blockchain data platform. You query indexed on-chain tables with SQL, or you start from public dashboards other people already published. It is not a one-click scam checker, and I would not open it when a pool is two minutes old and you need a plain risk call.
The upside is real if you can define the question. Cross-chain coverage, reusable queries, APIs, and connectors let a researcher or a product team turn one answer into a feed. The downside is the data model. Community dashboards vary. A chart can hide a bad join, a missing program, or a filter that drops the wallets you care about. Read the SQL before you trust the picture.
Throughput theater is a poor way to judge this layer. A Blockbench evaluation of Ethereum, Parity, and Hyperledger found Hyperledger reached up to 5.5× Ethereum's throughput and 28× Parity's, yet failed to scale past 16 nodes, with consensus driving much of the application-layer loss. Those systems were also far weaker than ordinary databases for large analytical workloads. For a query product, I care about fresh indexes, backfill, and how fast a question returns, not about validator marketing. Use Dune when you can write or audit the query. Don't use it as a substitute for a token-safety verdict.
6. Arkham
Investigations start from an anchor, not from a sector chart. A victim address, a deployer, or a known deposit wallet is enough to begin. Arkham is a blockchain intelligence platform for entity labels, address pages, token holder context, flow visualization, and alerts. The free product already includes labels and visual tracing. That is the job it fits: follow funds and name likely counterparties.
Labels can be incomplete or uncertain. I treat them as evidence to test, especially when a meme coin's "entity" is just a fresh keypair. Full history and Tracer 2.0 sit on Enterprise, so the free visualizer and a deep case file are not the same tool. API access is for teams who need the graph in their own workflow.
This is tracing and attribution, not a dedicated token risk score. It will not replace a liquidity check or a launch-minute trading review. When several addresses look related, Solana wallet clusters should stay in the "lead" column until transfers, funding, and timing agree. I would not use Arkham to green-light a brand-new pair, and I would not brief a case on an unlabeled address as if the silence meant the wallet was clean.
7. DeFiLlama
Protocol context and meme-coin forensics are different jobs, and mixing them up wastes the hour you have. DeFiLlama is a data platform for chains, protocols, and sectors. TVL, fees, revenue, volume, stablecoins, yields, and releases are the right tools when you are comparing ecosystems or checking whether a venue is a real market. Many of those dashboards are usable without a paid plan. Premium data is a separate cost.
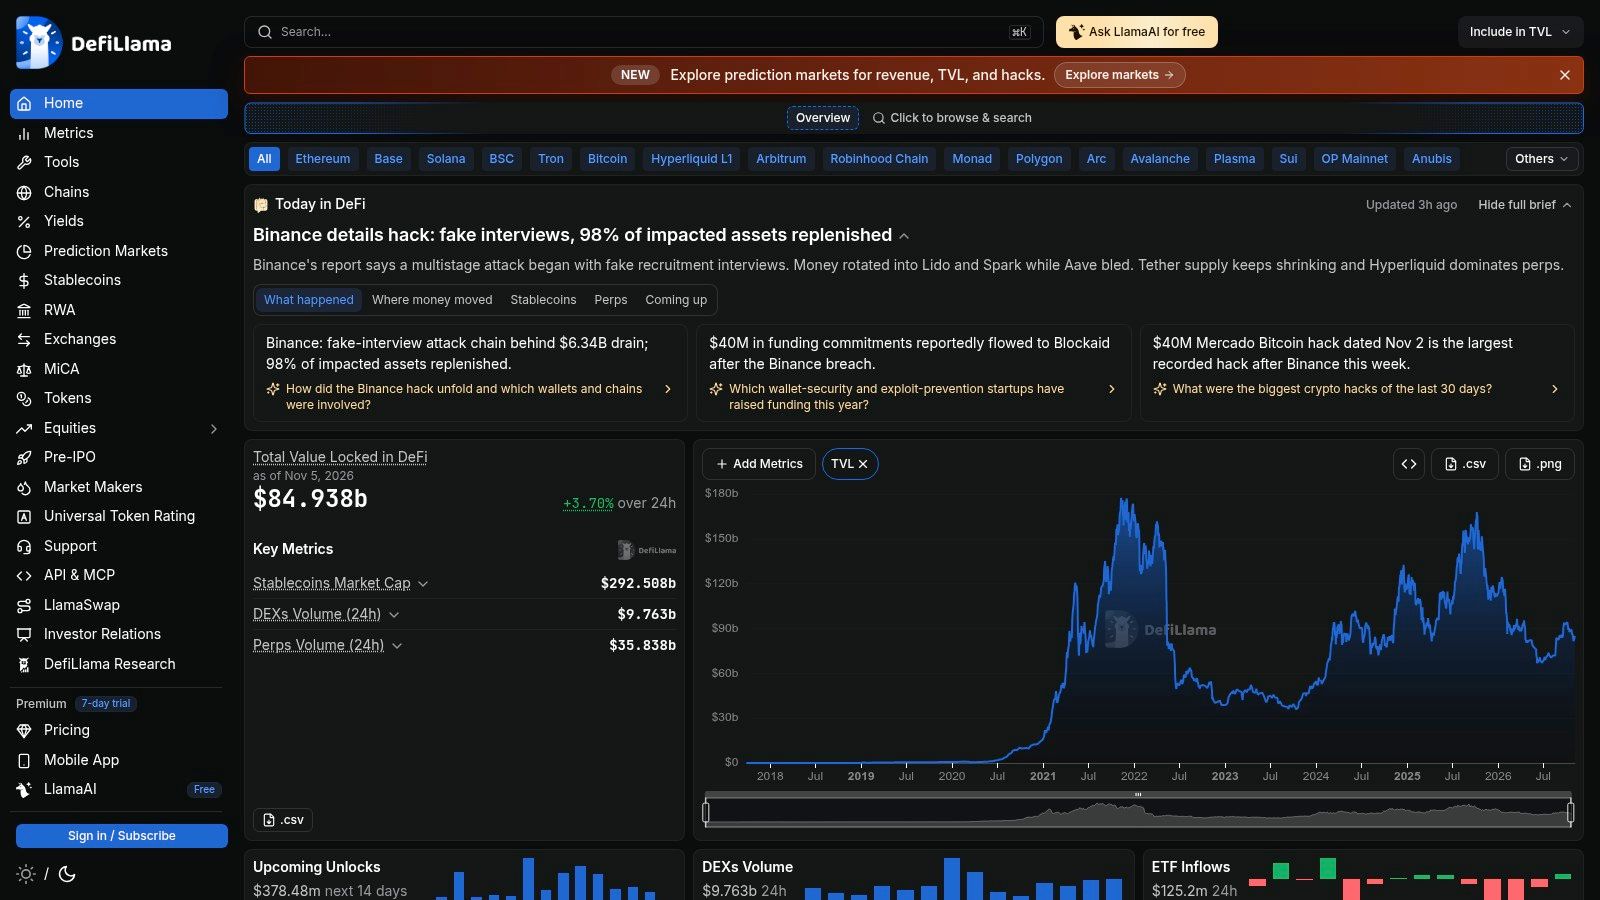
I would not use chain-level TVL to judge a new, thin meme coin. Aggregated fees don't show holder concentration, creator history, or whether the pool's liquidity can leave. A protocol can look busy while the token you were sent is a trap. Use DeFiLlama to place a trade in a market, then do address-level work somewhere else. It should not be your safety checker, and it should not be the last tab you open before you buy.
8. Token Terminal
When the asset is an established protocol, financial framing helps. Token Terminal is a data platform that lines up fees, revenue, users, usage, and valuation over time. You can compare projects the way you would compare operating metrics, export data, or push figures into spreadsheets. Free access covers core series and limited custom dashboards. Full API and warehouse access can require custom pricing, which fits a team more than a one-off buy.
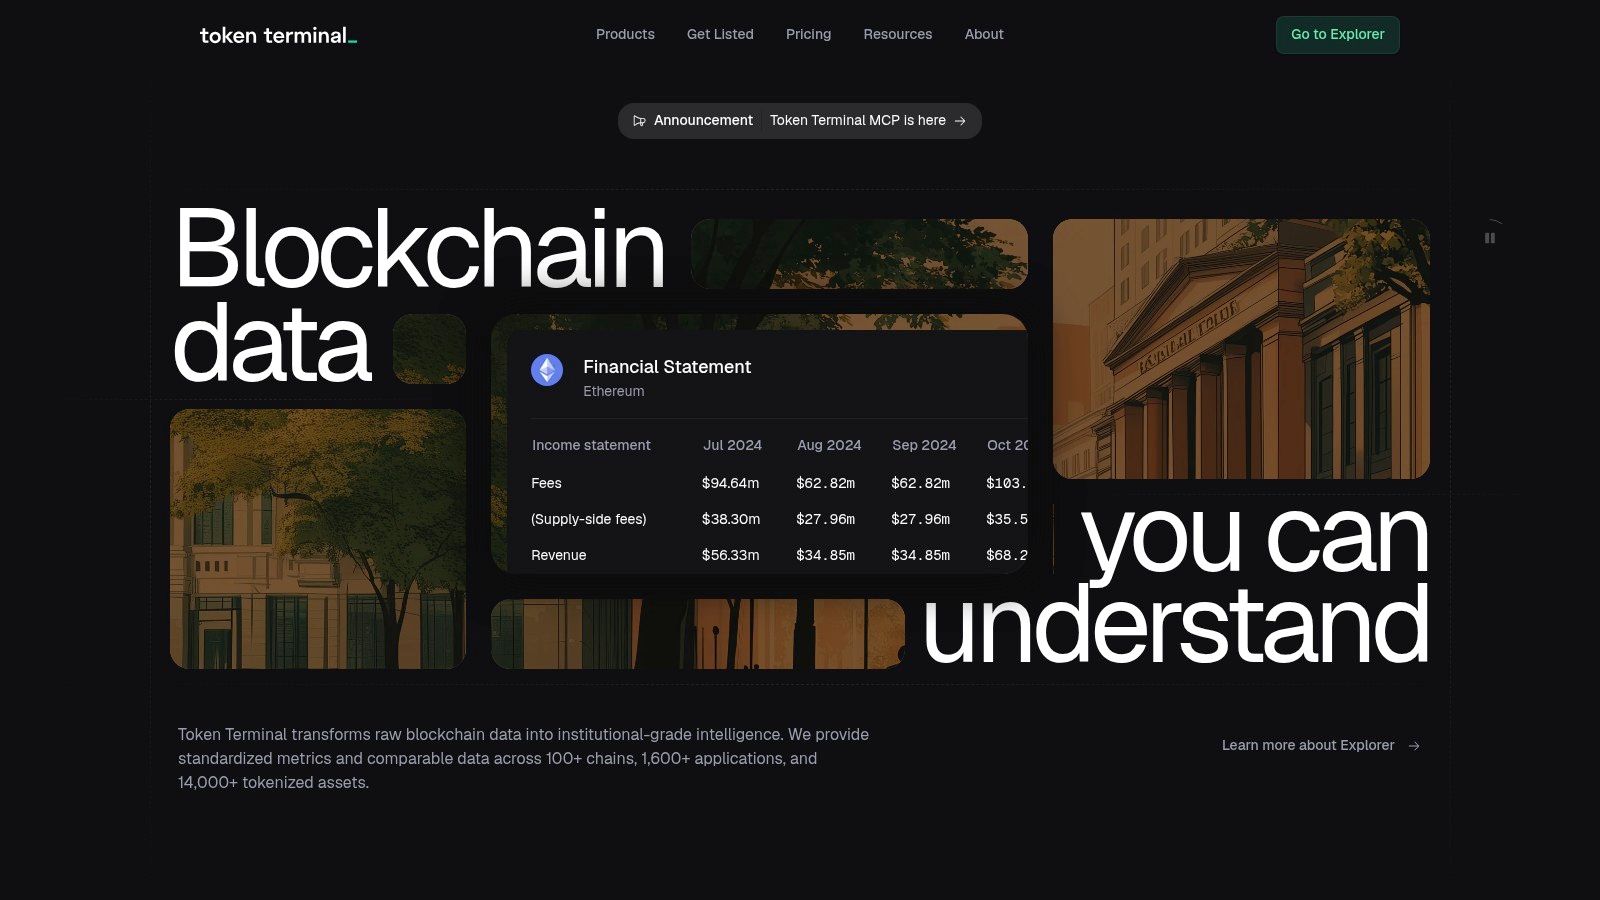
That orientation is the limit. A token with no sustained protocol activity does not have meaningful fee or cash-flow history, so the dashboards go quiet right when a meme launch is loud. I would not use it for a same-hour rug screen, mint-authority check, or holder-cluster review. I would use it for fundamental comparisons of protocols that already have users, and I would keep launch risk on a purpose-built checker. If the spreadsheet is empty, that emptiness is a scope mismatch, not a clean bill of health.
9. Glassnode
Macro questions need history, not a holder pie from ten minutes ago. Glassnode is a data platform for on-chain and market metrics, research dashboards, screeners, and an API whose depth depends on the plan. It is built to show how a network or a major asset has behaved over time. That is the right job for cycle context, long swings, and research notes that must be reproducible.
It is the wrong job for a fresh Solana meme. Many series describe established assets. They will not reconstruct a creator's first hour, a bundled buy, or a cluster of new wallets. Plan limits also mean the chart you see and the history your script can pull may differ. I would not ask it for an address-specific safety verdict. Use it to judge the broader tape, then switch tools the moment the question becomes "this mint, this pool, these holders." A rich catalog of network metrics still is not a token clearance.
10. Santiment
Some traders want the crowd in the same window as the chain. Santiment, through Sanbase, is a data platform that mixes on-chain, market, social, and developer activity. Screeners, watchlists, alerts, reports, a Sheets add-on, and an API support ongoing monitoring. Free access exists, and paid tiers go deeper. That combination fits a swing trader watching a listed asset's attention and its flows together.
Coverage is uneven by asset and chain, so a Solana meme may have a thin social series and almost no developer history. Social spikes and on-chain spikes still need interpretation. Neither one guarantees what price does next. I would not use Santiment as a specialized launch analyzer, and I would not treat an alert as a safety verdict. It belongs in a monitoring stack after you already know the token's controls, liquidity, and holder structure. If those checks are missing, sentiment is just noise with a chart attached.
How the Ten Tools Compare on Use Case, Chain Coverage and Pricing
These tools serve different jobs: some provide broad data platforms, while others focus on specific investigations or token checks. The table compares their primary use, stated coverage, and pricing model. A query platform can help answer a research question, but it should not be mistaken for a purpose-built token safety verdict.
| Item | Best-fit use case | Chain coverage | Pricing model |
|---|---|---|---|
| MemeAssist | Solana meme-token risk analysis, with an explained report and a conditional trade plan when data allows | Solana only | One eligible free full analysis, then prepaid, pay-as-you-go credits; no recurring subscription |
| Birdeye | Token screening, market data, and developer workflows | Strong Solana coverage | Some features and API capacity require paid access |
| Bubblemaps | Visualizing token holders and wallet relationships | Solana and multiple other networks | API access priced for builders; casual-user pricing is not stated |
| Nansen | Wallet labels, holder research, and Smart Money tracking | Solana, with broader multi-chain coverage on paid plans | Solana analytics available to registered users; advanced features require a paid plan |
| Dune | Custom blockchain queries and research dashboards | Multi-chain | Free access options; API and connector access is available, with pricing depending on the workflow |
| Arkham | Entity attribution and tracing wallet flows | Multiple supported blockchains; coverage depends on the asset and chain | Free platform; some advanced features are restricted to Enterprise |
| DeFiLlama | Protocol, chain, and DeFi ecosystem analytics | Broad, cross-chain coverage | Many core dashboards are free; premium analytics and data products cost extra |
| Token Terminal | Fundamental comparisons of protocols and blockchains | Supported protocols and blockchains vary by data series | Core data available free; full API access has custom pricing |
| Glassnode | Historical on-chain and market trends | Coverage varies by asset and chain | Plan-based access; API limits and data depth vary by plan |
| Santiment | Monitoring on-chain, market, social, and developer activity | Coverage varies by asset and blockchain | Free access and paid tiers for deeper data and tools |
Building a Stack That Matches the Job
No single product covers investigation, trading, and compliance well. I keep a data platform for context and a purpose-built checker for token risk. Every label, cluster, and score stays a lead until the transfers agree. For Solana meme coins I use MemeAssist for integrated research, explanation, and tracking, not as proof of safety or a profit promise. If a field is missing, that gap is not evidence the token is safe.
Why the catalog splits by job
Institutional demand and a retail buy are not the same workflow. A market estimate from MarketIntelo puts the global blockchain analytics market at approximately $5.4 billion in 2025, with a projection of $29.8 billion by 2034 at a 22.5% compound annual growth rate. Compliance-management applications were 35.7% of 2025 revenue, and large enterprises were 64.3%. That mix explains the heavy platforms in this list. They are built for monitoring, investigations, and reporting. They are not built to tell a trader, in plain language, whether a two-minute Solana pool can be pulled.
The last mile is separate from the score. Scam Sniffer figures reported by CryptoNews showed wallet-drainer phishing losses fell 83% year over year in 2025, to $83.85 million, while about 106,000 victims were still hit. The largest reported case used a permit signature to take $6.5 million. Lower totals do not make a connect button harmless. I don't want an analytics site to ask for a signature at all.
- Trading: Use a market platform for price and liquidity, then a Solana safety checker before you size a position.
- Investigation: Use maps, labels, and flow graphs to form leads, then confirm control with transfers and timing.
- Context: Use protocol, macro, and social platforms only after the token-level checks exist.
Suspicious links between wallets are a place to look harder, not a finding of misconduct. Query tools answer the question you wrote. They do not issue a clearance. If you need both the numbers and a readable account of what they mean, pair the platform with a checker and keep the signature step off the research tab.
MemeAssist turns a Solana token address into one explained risk report, covering liquidity, holders, creator behaviour, wallet activity, trading patterns, and historical indicators, without a wallet connection. If you are comparing blockchain analytics tools for meme-coin decisions rather than for protocol research, start with that check before you treat any chart as a go-ahead. Run a token through MemeAssist and read the breakdown before you trade.
Topics: blockchain analytics tools, Solana analytics, on-chain analysis, crypto investigation tools, wallet tracking tools
Informational only, not financial advice. Meme coins are extremely high-risk.
All articles