Bubble Map Explained: Reading Token Holder Concentration
Bubble map basics: what each bubble, size and link means, how to read token holder clusters, and how to avoid misreading them before you trade.
Published
Updated
A bubble map places items as circles on a visual field, with circle size showing magnitude; a token bubble map shows each wallet as a circle sized by its holdings, linked by lines for transfers. A wallet holding 79% of supply deserves investigation, but the circle alone can't tell you whether it belongs to a person, a liquidity pool, or another kind of account.
You're looking at a Solana meme coin, the price is moving, and someone has posted a colorful holder map as evidence that it's safe. Some circles stand alone; others form a tangled knot. Before you treat either pattern as reassurance or a warning, you need to know what the picture measures and which evidence it leaves out.
Table of Contents
- What a Bubble Map Is and Where the Idea Came From
- How to Read Every Element of a Bubble Map
- Separating Coordinated Insiders from Normal Activity
- Concentration and Liquidity Numbers Behind the Picture
- How to Build a Bubble Map That Stays Honest
- Check Timing and Exit Depth Before You Trust a Map
What a Bubble Map Is and Where the Idea Came From
Think of a dinner-table seating plan where each guest is a circle sized by how much food they took. You can spot who has the most, but you still don't know whether that guest is eating alone or serving everyone else.
The name bubble map covers several different visuals. A conceptual bubble map puts an idea in the center and connects it to attributes or evidence. For a token-risk outline, those branches might be liquidity, creator behavior, holder distribution, and trading activity. Circle size doesn't encode a measurement in this version.
The historical connection to quantitative circles goes back to William Playfair's 1801 representation of major European city populations using circle diameter, described in the SAS visualization paper. Modern bubble charts add horizontal and vertical axes, so position carries measurements rather than merely arranging related ideas.
Same circles, different meanings
Hans Rosling's 2007 TED presentation used income per person and life expectancy as axes, population as bubble size, and geographic region as color, an example discussed alongside the multidimensional format in Google's bubble chart documentation. That's a measured chart, not a wallet network.
A geographic proportional-symbol map puts circles at actual coordinates or region centers. A token holder map instead uses software to arrange wallet connections. A wallet appearing farther right doesn't mean it's richer, older, or riskier.
Use this visual as a reminder to inspect each channel separately.
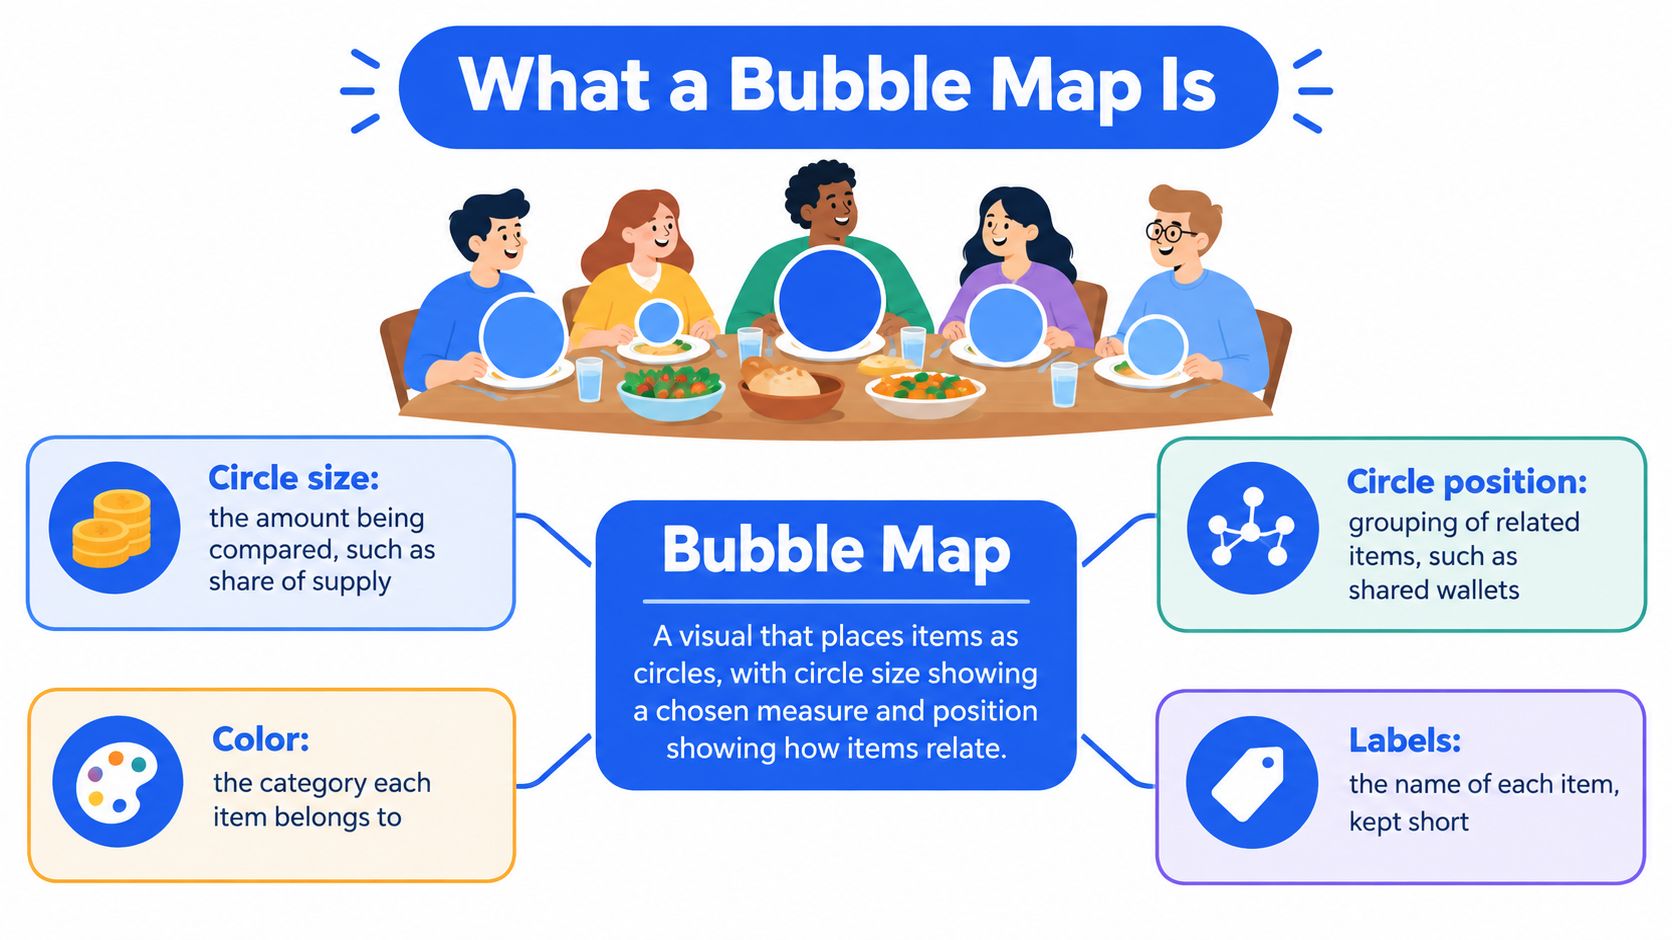
Four bubble visuals compared
| Type | Position means | Size and other channels | Typical use |
|---|---|---|---|
| Conceptual bubble map | Relationship to a central idea | Size isn't encoded; relationships only | Brainstorming and risk-factor outlines |
| Bubble chart | Measured variables on x and y axes | Additional variable as size; another as color | Comparing countries, companies, or tokens |
| Proportional symbol map | Real geographic coordinates or region centroid | Magnitude per place | Incidents, sales, or population by region |
| Token holder bubble map | Layout set by software; no numeric meaning | Holdings per wallet as size; lines for transfers | Holder concentration and wallet links |
Reading rule: Identify the visual before interpreting it. Circles can describe relationships, amounts, or both, but their placement doesn't always represent a measurement.
How to Read Every Element of a Bubble Map
At the dinner party, each wallet is a guest, its bubble reflects what it holds, and a transfer line resembles someone passing a plate. That line records an interaction, not a family relationship.
Start with the legend, then inspect the largest bubble and its exact balance. Next, confirm how the tool scales size and assigns color. Follow transfer lines into clusters, inspect isolated wallets, and finish by checking the capture time.
Read the marks before the pattern
The largest bubble could be a liquidity pool, an exchange wallet, or a locked contract. Open its address in a Solana explorer such as Solscan and compare the label with its transaction history. A label is useful context, not a substitute for checking what the account really does.
Bubble size is hard to estimate by eye. Similar-looking circles can hold meaningfully different balances, and overlapping circles can conceal smaller holders. Use the displayed percentage or token balance rather than guessing from the picture.
Color usually marks a group assigned by the tool. It helps you follow a cluster, but it doesn't establish that every colored wallet belongs to the same person. Check the legend because some tools use color for categories instead.
Reading key for a token holder bubble map
| Element | Usual meaning | What to check |
|---|---|---|
| Large bubble | Wallet holding a large share of supply | Exact percentage, and whether it's a pool, exchange, or contract |
| Bubble size | Share of supply or holdings | Whether the legend says diameter or area, and the unit |
| Bubble color | Cluster or group assigned by the tool | Color alone doesn't prove a shared owner |
| Line | Transfer between wallets | Direction, amount, and timing of the transfer |
| Cluster | Wallets linked to each other | Common funding source and timing before any conclusion |
| Isolated bubble | Wallet with no visible link in this snapshot | Not proof that the holder is independent |
| Snapshot time | When the data was captured | Whether later transfers have changed the picture |
For a line, inspect the actual transaction. Was it a token transfer, a funding transfer, or part of a swap routed through infrastructure? If the diagram doesn't show arrows or amounts, don't infer them.
For a cluster, collect the related addresses before investigating their behavior. For an isolated wallet, check whether the tool excludes small transfers, older activity, or holders outside its displayed range.
The snapshot time determines which transactions you should compare against the diagram. Save that timestamp alongside any conclusion so you can tell whether new activity invalidates it.
Separating Coordinated Insiders from Normal Activity
A highly connected map isn't automatically evidence of manipulation. A dispersed map can also conceal common control if someone funds wallets sequentially or splits a holding across fresh addresses.
Ownership concentration deserves attention: the cross-chain study described in Bubblemaps' meme-coin holder analysis guide examined 34,988 meme coins and found that 54.46% showed problematic ownership concentration, with the top 10 holders controlling an average of 77.85% in affected tokens. Those findings concern the study's sample, not a probability that any particular cluster is fraudulent.
The useful distinction is between a visible connection and evidence of coordinated control.

Test the cluster's explanation
Ask who funded the wallets, when they bought, and what they did after launch. These questions connect the diagram to behavior rather than appearance.
An exchange can send withdrawals to unrelated customers. A liquidity pool can interact with many traders, and an automated router can connect transactions without controlling the participants. Repeated exchange deposits therefore need careful interpretation: a common destination may be shared infrastructure, not a shared owner.
Closer review is warranted when a private wallet funds multiple buyers, their purchases land together around launch, and they later distribute or sell tokens in a coordinated way. None of those signals alone settles intent. Their value increases when independent evidence supports the same explanation.
Say a cluster shares an exchange withdrawal source, but its purchases and later sales are unrelated. That supports an infrastructure explanation more than an insider explanation. By contrast, coordinated funding followed by synchronized buying deserves a deeper transaction review; use the guide to checking whether a Solana token is bundled to investigate the launch activity.
Rapid Solana launches and bot trading make static diagrams particularly easy to overinterpret.
- Record the observation: Describe addresses, transfers, and timing without assigning motives.
- Name an alternative: State a plausible benign explanation and how you'd test it.
- Assign confidence: Use low for visual resemblance alone, medium for corroborating transaction patterns, and high when multiple independent checks support the connection. Record what evidence would change your mind.
Confidence in a wallet connection isn't the same as confidence that its owner will sell.
Concentration and Liquidity Numbers Behind the Picture
Our public dated report shows that the token dog was flagged on 29 July 2026 with one wallet holding 79% of supply; its price changed −69.3% over the following 24 hours. The obvious next question is what that wallet represented, not merely whether its bubble was large.
Across our 1,320 tokens flagged high rug risk and analyzed from 3 August to 22 October 2026, the average price change was −45.3% over 24 hours. This is a first-party result for flagged tokens, not a market-wide estimate or proof that concentration caused those declines.
A flag and a subsequent price fall establish an observed sequence. They don't establish which holder sold, whether liquidity was removed, or whether unrelated market conditions contributed. Those questions require transaction and market evidence.
Ownership isn't available exit cash
Market capitalization is a valuation calculation, not a reserve of money waiting to pay sellers. A token can have a large quoted value while its pool contains little of the asset sellers want to receive.
A holder map usually can't display that distinction. Even identifying the pool's token balance doesn't tell you how much SOL or another quote asset is available, how concentrated the liquidity is around the current price, or how your sale would affect execution.
Concentration and liquidity cases and what to check
| Case | Figure | What the map shows | Check next |
|---|---|---|---|
| Dog token, 29 July 2026 | One wallet held 79% of supply; price changed −69.3% over 24 hours | One dominant bubble | Whether the wallet is a pool, exchange, or single holder |
| High rug risk flags, 1,320 tokens, 3 August to 22 October 2026 | Average 24-hour price change −45.3% | Holder distribution at flag time | Price history and transactions after the flag |
| Meme-coin ownership study | Concentration measured across a cross-chain sample | Uneven distribution among holders | Whether leading holders share funding or transfers |
| Tokens with strong positive returns | Artificial-growth evidence requires trading analysis | Holdings, not authenticity of demand | Trading volume and executable depth |
| Tokens claiming very large market capitalizations | Claimed valuation isn't available liquidity | Distribution of token balances | Quote-asset reserves and active liquidity |
| Tokens with low liquidity relative to valuation | Exit capacity must be measured separately | A holder map can appear dispersed | Whether the intended position can exit |
The top-holder concentration guide helps distinguish a large displayed balance from economically meaningful holder control. Keep that ownership question separate from the pool's ability to support selling.
A holder's share tells you how much supply they could offer. Executable liquidity tells you what buyers and pools could pay for it.
Say you hold a modest position in a token with many unrelated owners. If the available quote asset is thin, your sale may still receive far less than the displayed price suggests. Distribution can reduce one kind of concern without resolving execution risk.
How to Build a Bubble Map That Stays Honest
An honest bubble map makes its encoding visible and keeps exact values accessible. Decide what readers should learn before choosing colors or arranging circles.
The process begins with the question, not the drawing.
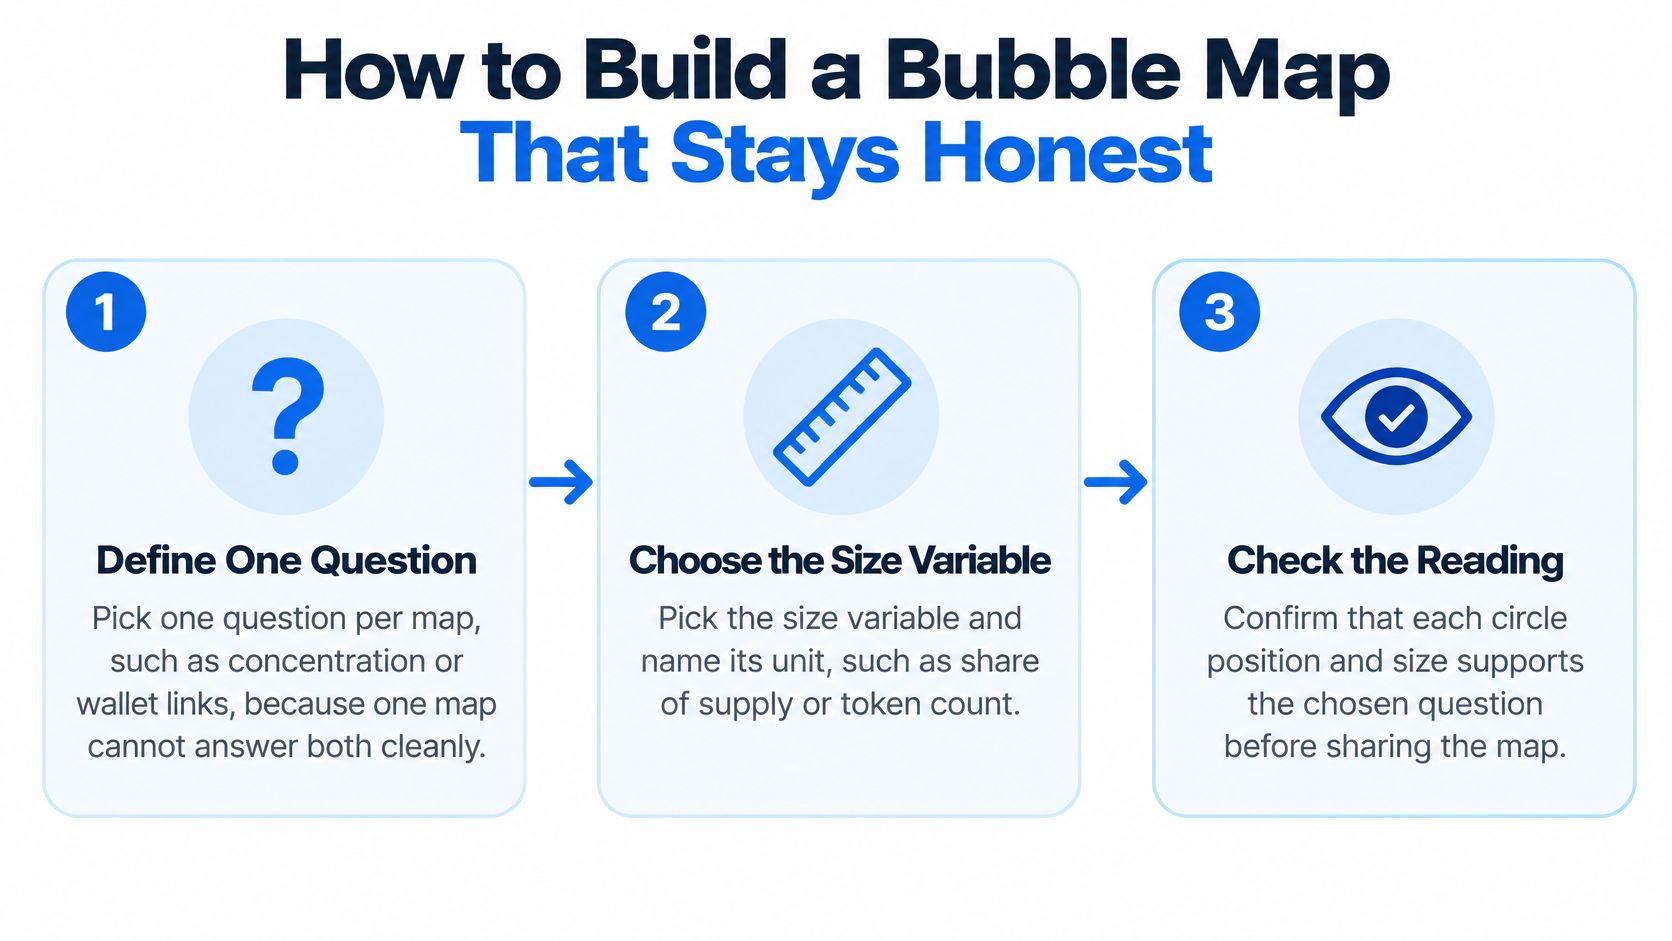
Choose and disclose the encoding
Define the primary question. Decide whether readers need to compare holdings or investigate wallet relationships. A network can support both, but one question should guide its layout and supporting information.
Choose the size variable and name its unit. Share of supply and token count answer different questions, especially when readers compare maps across tokens.
Scale by area rather than diameter. The AnyChart proportional-symbol map documentation explains why diameter-based scaling can exaggerate large-to-small differences. Calculate radius from the square root of the value so visible area stays proportional.
Cap the displayed radius when a dominant holder would obscure surrounding wallets. Disclose the cap and retain the uncapped value in the tooltip, because visual convenience shouldn't silently change the measurement.
For highly skewed holdings, a logarithmic or quantile transformation can keep small wallets visible. However, transformed circles no longer support a straightforward proportional comparison, so label the transformation prominently.
Preserve access to the underlying values
Write a complete legend. Include the unit, scaling method, color meaning, snapshot time, and any holder exclusions. A reader shouldn't have to guess whether a missing wallet was filtered out.
Handle overlap with transparency, zoom-dependent rendering, and interactive tooltips. If you aggregate wallets into a cluster, let readers expand it and inspect its members rather than displaying only a total.
Pair the diagram with an exact table. Include wallet addresses, balances, labels, and the evidence used to assign connections. If you apply a risk threshold, explain its rationale rather than presenting it as a universal safety boundary.
Split crowded views into small multiples. Keep scales consistent across snapshots, and separate ownership, trading, and geographic views when combining them would confuse the reader.
A perceptual test described in the SAS visualization guide found 31% accuracy for a bubble-map treatment versus 20% for a choropleth baseline on a mean-color estimation task. That's a narrow comparison, not evidence that readers can reliably estimate wallet holdings from circles.
Design check: If removing the tooltip makes the conclusion uncertain, keep the exact figures beside the visualization.
Use the video as a companion to checking the map's visual choices.
Check Timing and Exit Depth Before You Trust a Map
A bubble map is an input to a trade or hold decision, not a verdict. The relevant question is whether its evidence still describes the token you're about to trade.
A Solana token study analyzing 6.4 million tokens across seven months reports that most fraudulent characteristics appeared within the first hour and that models using only the first five minutes of trading data could detect risk. Early observations can be useful, but they don't guarantee that later conditions remain acceptable.
Recheck the sequence and the exit
- Compare snapshots: Capture the launch state, revisit it after the early trading period, and refresh before acting. Use consistent filters so changes aren't merely display differences.
- Track balance changes: Inspect transfers since your previous capture, including creator-wallet movements and supply distributed to fresh addresses.
- Record launch activity: Preserve the initial trades and investigate bundled or coordinated purchases alongside the funding history.
- Measure current depth: Inspect active liquidity and quote-asset reserves, using a Solana exit liquidity check as part of the assessment.
- Stress-test your intended sale: Obtain a current swap quote for the position size and inspect price impact, minimum received, and route quality. A quote isn't guaranteed execution.
- Verify locks: Check what is locked, who can change the conditions, and whether the evidence is independently accessible.
A dispersed holder base doesn't make thin liquidity usable. Conversely, concentration may be manageable when holder behavior, executable depth, and lock conditions support the intended position.
Before trading, ask: Has the ownership picture changed since the last major transfer? Can my position exit at a price I accept? Can I independently verify the liquidity and locks?
Our free scanners support a first check; a full MemeAssist analysis explains the evidence behind its health score and rug risk rating, adds an AI verdict and detailed risk analysis, and includes a conditional trade plan when data allows. Each report reflects information available at analysis time, so a saved report may become outdated immediately afterward.
MemeAssist brings holder distribution, wallet activity, and market conditions into an explained Solana token report. Visit MemeAssist to investigate the evidence behind a cluster and assess exit conditions before relying on the picture alone.