Crypto Analytics Platform Guide for Traders
Chainalysis estimated that illicit cryptocurrency addresses received $40.9 billion in 2024, a figure that could rise as investigators attribute more addresses to illicit activity, according to its 2025 Crypto Crime Report. That figure reframes what a crypto analytics platform is for: not to declare a token “safe,” but to help you identify which evidence supports a decision, how current that evidence is, and what it can't tell you.
For a Solana meme coin, the distinction matters most in the first hour. A risk reading is a snapshot of changing conditions, not a permanent verdict. And even a favorable token-safety assessment doesn't tell you whether your trade can execute near the price you see.
Table of Contents
- Why Volume Makes the Platform Choice Matter
- Platform Fit by Coverage Timing and Price
- What Each On-Chain Signal Proves
- Read Risk as a Path Through the First Hour
- What You Should Pay for per Decision
- Match Each Situation to One Stack
Why Volume Makes the Platform Choice Matter
Chainalysis measured illicit activity at 0.14% of attributed crypto transaction volume in 2024, down from 0.61% in 2023. It also estimated that stablecoins made up 63% of illicit transaction volume that year. Those figures describe a small share of a vast system, not a guarantee that any individual token, wallet cluster, or liquidity pool is low risk.
The broader market makes timely analysis important for a different reason. CoinGecko's 2025 Annual Crypto Industry Report says average daily trading volume reached a yearly high of $161.8 billion, while the market ended the year at approximately $3.0 trillion in capitalization, down 10.4%. The report also records stablecoin market capitalization rising 48.9% to $311.0 billion, and centralized-exchange perpetual trading volume rising 47.4% to $86.2 trillion.
A crypto analytics platform turns observations from blockchains and markets into a decision: investigate, ignore, size, or skip. But tools sold under that label often do different jobs:
- Compliance attribution links wallets and fund flows to known entities, clusters, and typologies.
- Market research helps traders study cycles, asset flows, and labeled wallets.
- Pre-trade token risk checks a specific asset's liquidity, holders, creator activity, and trading patterns.
The right tool depends on the decision in front of you, not on how many dashboards a platform offers. Compare candidates on coverage, timing (live or historical), evidence type, cost per decision, and who will use the result.
A low share of illicit activity across the market can coexist with severe risk in one launch or pool. That's why a useful report pairs numerical indicators with an explanation, and distinguishes observed evidence from estimates that can change as attribution improves.
Platform Fit by Coverage Timing and Price
| Platform | Best for | Coverage | Timing | Evidence style | Pricing shape |
|---|---|---|---|---|---|
| Chainalysis | Investigations and sanctions exposure | Multi-chain attributed addresses | Historical graphs plus alerts | Clusters, typologies, asset class | Enterprise quote |
| TRM Labs | Institutional fraud monitoring | Multi-chain and off-chain risk context | Monitoring near real time | Wallet screening, transaction tracing | Enterprise quote |
| Nansen | Smart-money and fund flow | Labeled wallets across major chains | Live labels plus history | Entity flows and wallet labels | Subscription |
| Glassnode | Market-cycle and macro context | Bitcoin, Ethereum, and major assets | Historical metrics, some live | Supply, exchange flows, derivatives | Free tier plus subscription |
| Dune | Custom questions on decoded data | Chains the user can query | Historical, refresh depends on the query | User-built dashboards | Free tier plus paid compute |
| Arkham | Entity identification | Labeled addresses and transfers | Alerts plus history | Entity profiles | Free browsing plus paid intel |
| Birdeye or DexScreener | Spot price and pair screens | DEX pairs, strong on Solana | Live charts | Price, volume, light holder data | Mostly free, some paid APIs |
| MemeAssist | Solana meme-coin risk before a buy | One Solana token at run time | Live report, not a permanent score | Liquidity, holders, creator, wallets, trading patterns, history | Pay per new analysis |
Match the evidence to the job
Chainalysis and TRM Labs are built for investigation and institutional monitoring. Their attribution, tracing, and risk context serve compliance or fraud teams better than someone deciding whether to enter a new meme-coin pool. Their enterprise pricing also fits organizational workflows better than an occasional retail check.
Nansen and Arkham help users follow labeled wallets and entity flows. They're useful when your question concerns who is moving funds, not whether a particular token's current liquidity can absorb your order. Glassnode adds market-cycle context for major assets, but it isn't a substitute for investigating a freshly created pool.
Dune is for analysts with a question that a preset dashboard doesn't answer. You build the query and interpret the result, which gives you flexibility but makes freshness depend on how the query runs. Birdeye and DexScreener are efficient starting points for live DEX prices, volume, and basic pair checks, especially on Solana.
MemeAssist is a narrower fit: an on-demand report for a Solana token when the question is its risk before a buy. It isn't exclusive chain data or a compliance investigation system. If you're comparing alert products rather than analysis reports, this comparison of Solana token alert tools can help separate monitoring from one-off screening.
Selection rule: Choose the row whose evidence matches the decision, then cut subscriptions that duplicate it. Before paying for any tool, test its labels and updates against a token or wallet whose history you can independently inspect.
What Each On-Chain Signal Proves
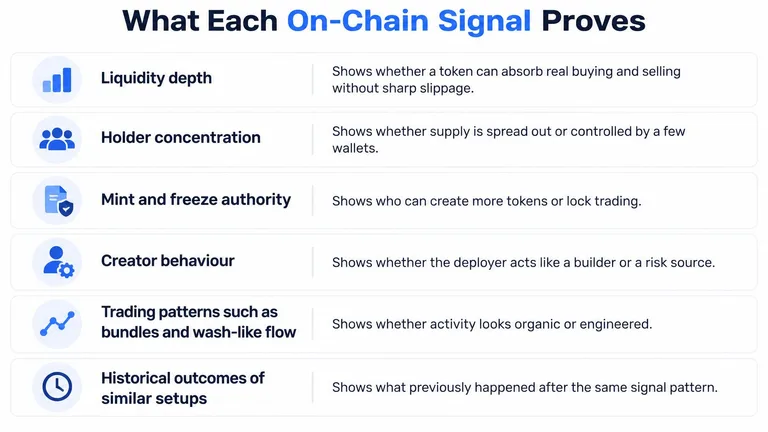
A signal is useful only when you know what decision it supports and where its evidence stops. This table separates a practical reading from an overconfident interpretation.
| Evidence | It can support | It cannot support | Stale when |
|---|---|---|---|
| Liquidity depth and lock status | Whether this trade size can exit now | That liquidity will remain | The pool changes, particularly during launch |
| Holder concentration | Who can move the price | Seller intent | Large transfers change the distribution |
| Mint and freeze authority | Whether supply or trading can still be altered | That current holders are honest | Authority status changes |
| Creator behaviour | Repeat deploy or drain patterns | That a brand-new wallet is safe | Linked wallets appear |
| Bundles, insiders, wash-like flow | Manufactured volume or coordinated buys | Every later loss | Trading patterns change during the launch window |
| Historical flag outcomes | Whether a screen has been calibrated | This token's future price | The model or sample changes |
| Sanctions and address attribution | Compliance exposure of a wallet | Execution quality of a meme trade | Attribution is updated |
Liquidity depth helps estimate whether an order of your intended size can sell into the pool at acceptable slippage now. It can't promise that liquidity will remain when you try to exit. Treat a visible depth figure as a snapshot, not a standing exit guarantee.
Holder concentration shows whether a small number of wallets control a large share of supply, which can help you assess who might move price. It doesn't establish why a holder will sell. Mint and freeze authority checks show whether someone can still change supply or restrict transfers, but they don't prove that the existing holders are trustworthy.
Creator behaviour can connect a deployer with prior activity or related wallets. That history can support caution, but a clean history from a newly created wallet is weak evidence of safety. Bundles and wash-like flow can reveal coordinated buys or activity that may not reflect independent demand. They can't establish what every later buyer or seller will do.
Historical outcomes are useful for testing whether a screening rule has been calibrated against past cases. They don't predict a particular token's price. Sanctions and attribution labels can matter in compliance work, but a labeled wallet is not a slippage estimate. For practical ways to interpret suspicious volume, see this guide to detecting wash trading on Solana.
Timing changes how much confidence you should place in any row. An independent Solana data API benchmark reports event-to-API emission as low as 99 ms on a fast path, 779 ms on a slower path, and a 13,433 ms outlier, against Solana's roughly 400 ms block interval. Provider, endpoint, confirmation policy, and processing can all add delay.
A credible live report should show the observation's slot, block time, ingestion time, and processing status, and identify provisional versus confirmed signals. Average response time alone can hide slow tails. Measure p50, p95, and p99 end-to-end latency to see whether a report is fresh enough for the decision you're making.
Read Risk as a Path Through the First Hour
An early report can look reassuring because there isn't enough activity to assess. That distinction is central to interpreting new tokens: insufficient evidence is not evidence of low risk.
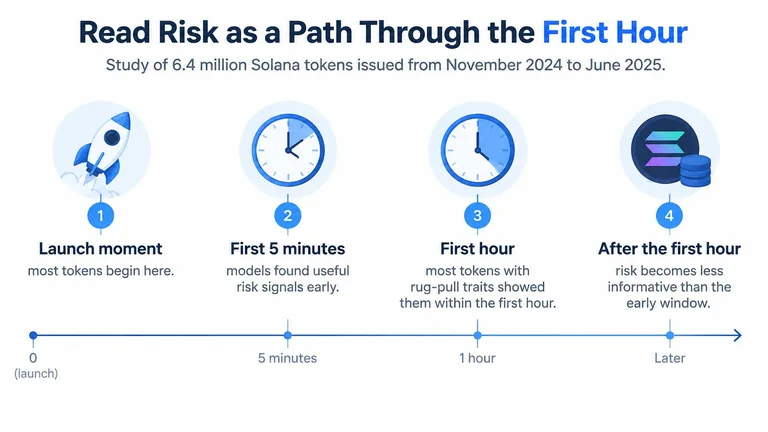
A study of 6.4 million Solana tokens issued between November 2024 and June 2025 found that most tokens exhibiting rug-pull characteristics showed them within the first hour. The study also found that machine-learning models could identify meaningful risk using just the first five minutes of trading data, as described in the study on Solana token launches and rug-pull risk.
| Stage | Check | Reading | Next action |
|---|---|---|---|
| Launch | Authorities, holder set, pool age | Insufficient evidence, not a pass | Hold and wait for trades |
| Five minutes | Liquidity arrival, bundled buys, creator mint or freeze power | Early trajectory, provisional | Rerun and store timestamp |
| One hour | Concentration, creator-linked transfers, sell execution near quote | Confirmed or cleared signals | Rerun on any change |
| After one hour | Historical outcomes and slower research | Context, not a snapshot | Use research tools |
At launch, record what you don't know
Check whether mint or freeze authority remains, whether the pool exists, and whether there's enough holder and trading activity to interpret. A thin or empty evidence set shouldn't produce a confident “low risk” conclusion. Wait for transactions that make liquidity and wallet behaviour assessable.
At five minutes, test the emerging pattern
Recheck whether liquidity has arrived, whether early buys appear coordinated, and whether the creator still holds authority that could alter supply or transfers. Mark these observations as provisional and save the timestamp. The point isn't to treat an early model signal as a final verdict, but to see whether the risk picture is changing.
At one hour, verify what traders can do
Reassess holder concentration, creator-linked transfers, and whether sells can execute near the quoted price. A token may show no obvious issuer-risk signal while still offering poor execution. Rerun the report when liquidity, large-holder balances, or trading patterns change; don't rely on an earlier score as if nothing moved.
After the first hour, historical comparisons and slower research can add context, especially if the pool and ownership pattern have settled. The failure mode is an early clean result that never gets refreshed. Store each score with its evidence age, and read it as a trajectory, not a permanent label.
What You Should Pay for per Decision
Pay for the decision you need to make, not the size of a vendor's logo. An enterprise attribution platform can make sense when a compliance team must trace funds and screen counterparties. It's an expensive mismatch for a retail trader who needs one token check before a trade.
The same logic applies to subscriptions. If you use market-cycle and wallet-flow dashboards most days, paying for a research platform may earn its place. If several subscriptions redraw the same price and holder chart, you're paying repeatedly for overlapping evidence. Dune-style query platforms can also become costly when compute use follows casual exploration instead of a defined analytical question.
Match pricing to how often you decide
Free DEX screens are a sensible first look at a pair's price and trading activity. They're not a complete answer when your trade size may exceed visible depth or your decision depends on creator history and token authorities. For an intermittent Solana check, per-analysis pricing can align cost with each new decision rather than requiring an ongoing subscription; MemeAssist's pricing page describes that model.
Write down your cadence before choosing: daily research, weekly review, or one launch at a time. Then compare the cost with the evidence you'll use. A platform's core price may not cover optional alerts, follow-up questions, exit checks, or data overages, so count those separately.
Practical rule: If two invoices answer the same question, cancel one. If a free chart can't show the authority status, creator history, or execution limits you need, the gap in evidence may be more costly than the paid check.
Public token evidence and saved reports don't need to be repurchased just to reread them. Reserve new-analysis spending for a changed token or a fresh decision, rather than paying again for information you've already saved.
Match Each Situation to One Stack
The strongest platform is the one that answers the specific question you're facing. A compliance investigation, a market-cycle review, a pair check, and a trade-entry decision each need different evidence.
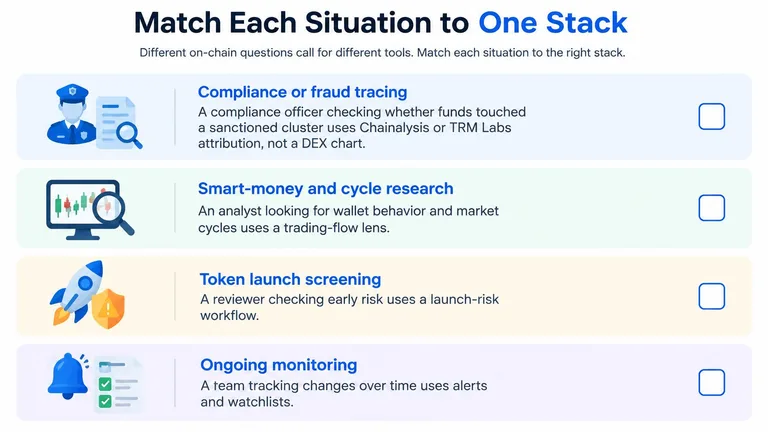
Compliance or fraud tracing
A compliance officer checking whether funds touched a sanctioned cluster needs Chainalysis or TRM Labs attribution, not a DEX chart. Those platforms are designed to connect wallet activity with broader fund flows and risk context. A price screen can show a market pair, but it can't replace the investigation work of following assets through relevant addresses.
Don't confuse tracing with proof of a person's identity. Wallet labels and address associations are evidence for investigation and screening; they're not, by themselves, the full case. For law-enforcement or institutional work, choose tools and workflows built for attribution, review, and documentation.
Smart-money and cycle research
A fund studying whether labeled whales are rotating can use Nansen or Arkham to inspect wallet labels and flows, with Glassnode for major-asset cycle context. Each tool answers a different part of the question. A wallet label can help identify an entity or flow, while a macro metric gives context about a larger asset market.
If you need a custom view that none of those dashboards provides, use Dune to query decoded chain data. Be explicit about the question before building the query, and check how often the result refreshes. A custom dashboard is only useful for a timely decision if its inputs are timely enough.
Pair screening and token entry
A Solana trader checking a new pair can start with Birdeye or DexScreener for live price, volume, and a quick market view. That first screen helps establish what the pair is doing. It doesn't settle whether the token's creator, authorities, holder mix, or trading pattern creates a separate risk.
Before sending size, separate issuer risk from execution risk. A token can have no obvious rug signal and still produce a poor trade if the pool is thin, the order is large relative to depth, the route is unfavorable, or slippage settings are too loose. A 2025 measurement study of Solana's Jito ecosystem found more than 500,000 sandwich attacks associated with more than $7.7 million in victim losses across more than four months of early-2025 data. It also identified more than 2.4 million defensive user behaviours that offered little benefit beyond preventing sandwiching, according to the study of sandwich attacks in the Jito ecosystem.
Those findings point to a practical distinction: token safety doesn't equal trade safety. Check whether your intended order can move price, whether the quoted price is realistic for the size, and whether your slippage and priority-fee choices fit the conditions. A favorable safety rating shouldn't be read as a promise that your trade will fill cleanly or exit at a particular price.
Don't mistake on-chain screening for fraud prevention
On-chain analytics can't replace caution about off-chain scams. The U.S. Department of Justice, citing FBI data, reported that cryptocurrency investment fraud caused more than $5.8 billion in losses in 2024 in its announcement on cryptocurrency investment fraud. A token report can help you examine on-chain evidence, but it can't verify every person, promise, or investment pitch outside the ledger.
Use these three verdicts to keep the stack lean:
- For sanctions, fraud, or law-enforcement work, pay for an enterprise attribution platform such as Chainalysis or TRM Labs.
- For ongoing research, keep one wallet-label or macro subscription and one query tool if you use them, then cancel duplicate dashboards.
- For a Solana meme coin before a buy, start with a free pair screen, then consider a live report. A full MemeAssist token analysis with conditional Trade Setup costs $0.20 and provides an Overall Health Score, Rug Risk Rating, AI Verdict, and Detailed Risk Breakdown. It's informational analytics, not personalised advice, and a safer score doesn't make execution safe.
Name the decision you need to make, match it to one tool class, and pay only for the evidence that's still missing.
MemeAssist brings Solana token signals and plain-English analysis together in an on-demand report, including a conditional trade plan when the data allows. Before your next meme-coin entry, visit MemeAssist to review the evidence behind a token's risk and trading conditions.
Topics: crypto analytics platform, on-chain evidence, real-time analytics, Solana risk, token screening
Informational only, not financial advice. Meme coins are extremely high-risk.
All articles