Crypto Market Analysis Tool: A Complete Guide for 2026
Discover the crypto market analysis tool that tracks trends, portfolio performance, and real-time data. Find your perfect fit with our 2026 guide.
Published
Updated
A crypto market analysis tool must evaluate more than price and volume. Recent Solana research identified 76,469 rug pulls among 100,063 tokens launched during the first half of 2025, meaning roughly 76.4% of that observed token set was classified as rug pulls.
That figure changes the buying question. The issue isn't which dashboard has the longest feature list. It's whether a tool can separate organic demand from coordinated activity, distinguish token safety from exit liquidity, and show how risk changes while a token is still young. A static safety badge can describe one moment, but early-life-cycle risk often develops through changing liquidity, wallet concentration, creator behavior, bundled purchases, and trading intensity.
A useful crypto market analysis tool therefore combines market data with on-chain evidence, refreshes both at execution time, preserves the evidence behind its conclusions, and checks whether its alerts were accurate after the event. The history of crypto analytics points in that direction. CoinMarketCap launched in May 2013 as a public-facing aggregation platform for prices, market capitalization, trading volume, and historical information, then introduced its first public API in May 2016. Its reported page views grew from 3.6 billion in 2018 to 13.2 billion in 2021, while monthly visitors exceeded 340 million in June 2022. CoinMarketCap's account of crypto market data's development shows the broader shift from manually checking exchanges to building machine-readable market infrastructure.
Table of Contents
- Why One Crypto Market Analysis Tool Is Not Enough
- On-Chain Data Versus Market Data
- The Case for Live Data Ingestion
- Evaluating Alerting and Feedback Systems
- Custom Scoring and the Tradeability Gap
- Single-Chain Depth Versus Multi-Chain Breadth
Why One Crypto Market Analysis Tool Is Not Enough
The assumption that all crypto analysis platforms are interchangeable fails at the token's most dangerous moment, its early life. Research covering 100,063 Solana tokens launched during the first half of 2025 classified 76,469 as rug pulls, with the affected tokens showing short lifecycles, price-driven behavior, and coordinated activity. The Solana token research points to a problem that a conventional chart scanner can't solve: a token may look active precisely because coordinated participants are creating the appearance of demand.
A price chart answers what the market has done. It doesn't establish who supplied the liquidity, whether wallets are related, whether the creator is selling, or whether a burst of volume reflects genuine participation. Those questions require on-chain surveillance, and they need to be interpreted against the token's age and recent changes.
Two analytical jobs require different evidence
A capable system has to perform two related but distinct jobs:
| Analytical job | Questions it should answer | Evidence required |
|---|---|---|
| Market behavior | Is demand strengthening, fading, or reversing? | Price, volume, liquidity, slippage, and price impact |
| Token and wallet risk | Could the activity reflect manipulation, insider behavior, or a liquidity exit? | Holder concentration, creator-linked wallets, transaction patterns, bundles, and fund flows |
The distinction matters because neither dataset is sufficient alone. Market data can reveal weakening execution, but it may not identify the wallets driving a move. On-chain data can expose concentration or suspicious activity, but it still needs market context to show whether a trader can enter or exit without materially moving price.
Practical rule: Treat a risk score as an argument that needs evidence, not as a substitute for evidence.
Crypto analytics has matured because the market itself became too fragmented and fast-moving for manual inspection. Aggregation solved the first problem, access through APIs solved the second, and modern token analysis now has to address a third: interpreting behavior under uncertainty. Comparisons such as MemeAssist versus Nansen are useful only when they examine those underlying analytical jobs rather than counting surface-level features.
The better question isn't whether one platform contains every metric. It's whether the tool connects the metrics that can explain one another. A sudden volume increase paired with broad holder growth may tell a different story from the same increase paired with repeated wallet clusters, weak price impact, and creator-linked selling. Static checks flatten those differences. Temporal analysis preserves them.
On-Chain Data Versus Market Data
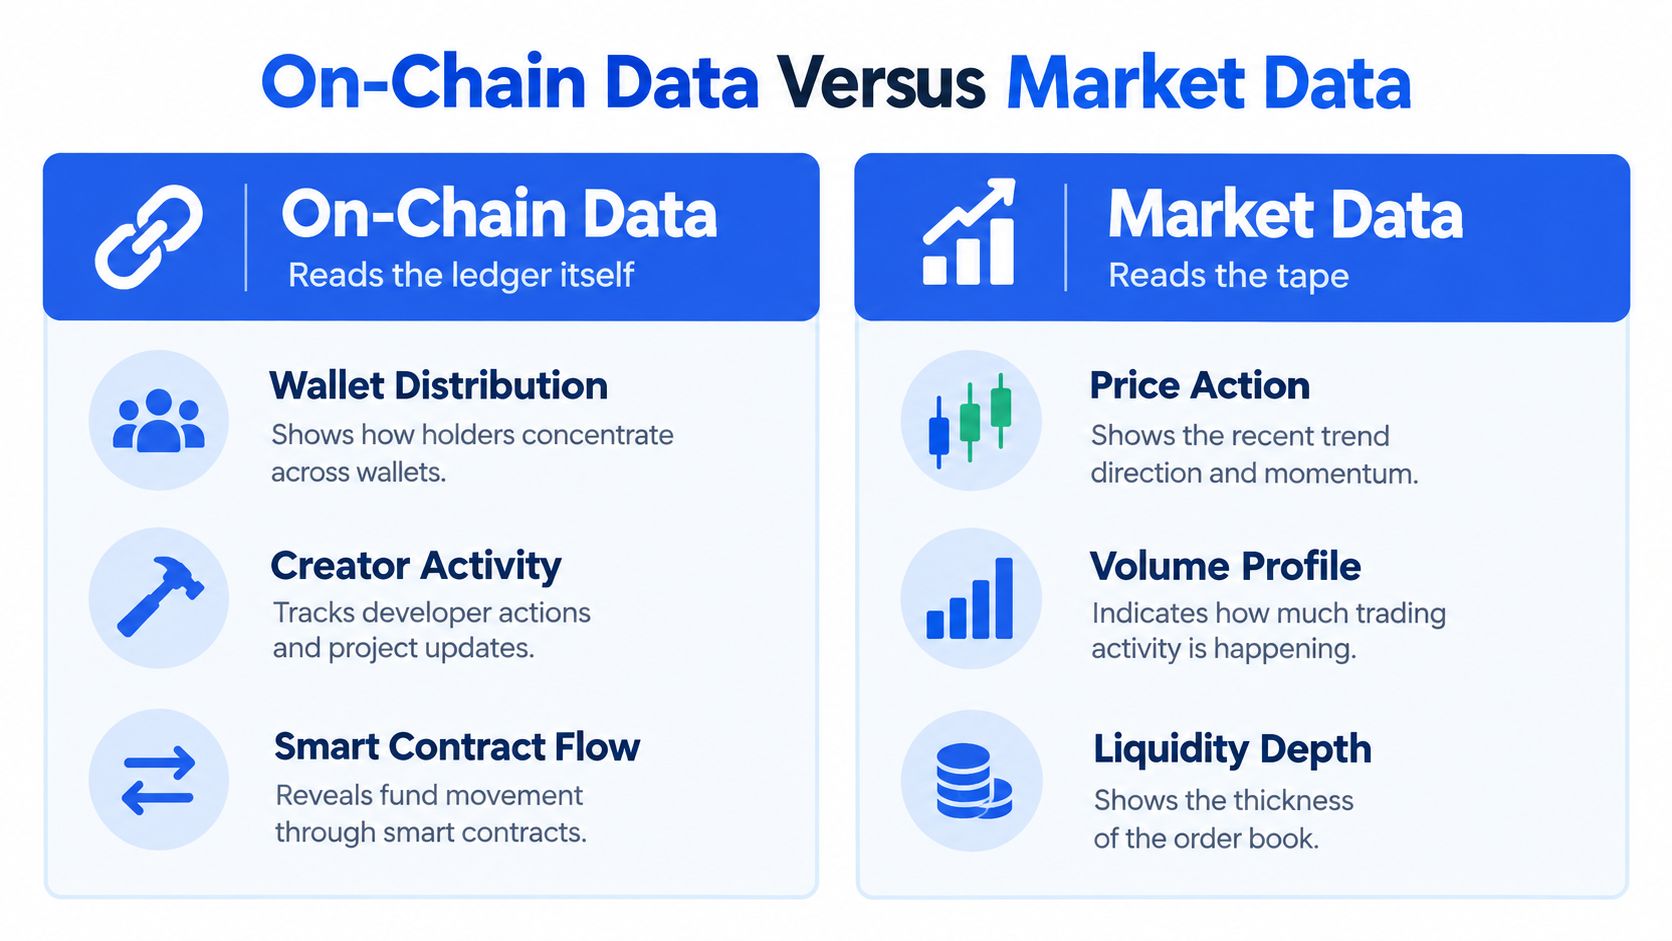
Market data and on-chain data describe the same event from different viewpoints. Market data reads the tape, while on-chain data reads the ledger. A trader evaluating a Solana token needs both because price movement shows the visible result, but wallet and transaction evidence can reveal the mechanism behind it.
What market data can and can't establish
Market data is strongest when the question concerns execution and observable demand. Price action shows direction and reversal. Volume indicates trading intensity, although it shouldn't be accepted as genuine without validation. Liquidity depth, slippage, and standardized price impact show whether a position can be traded at a reasonable cost.
It becomes weaker when traders use it as a proxy for trust. A high-volume token may still have fabricated activity, related counterparties, or a concentrated holder base. A rapidly rising price can reflect coordinated purchases rather than broad participation. Market data tells you what happened in the venue, not necessarily whether the behavior was organic.
What on-chain data adds
On-chain analysis examines wallet distribution, creator activity, liquidity ownership, transaction bundles, and fund movement. It can connect a market event to the addresses involved, identify concentration, and reveal whether apparent participation is spread across independent wallets or clustered among related entities.
The risk case is larger than meme coins. Chainalysis reported that illicit cryptocurrency addresses received at least $154 billion during 2025, a 162% increase from its revised 2024 estimate of $57.2 billion, while illicit activity remained below 1% of total attributed transaction volume. Chainalysis's 2026 Crypto Crime Report introduction also reported that stablecoins represented 84% of illicit transaction volume. These figures don't imply that liquid assets are inherently unsafe. They show why liquidity and legitimacy must remain separate analytical dimensions.
| Signal | Market-data interpretation | On-chain interpretation |
|---|---|---|
| Rising volume | More trading is occurring | Which wallets and counterparties generated it? |
| Strong price move | Demand appears aggressive | Are purchases coordinated or creator-linked? |
| Deep pool | Execution may be easier | Who controls the liquidity, and can it change suddenly? |
| Broad activity | Participation looks active | Are holders independent or clustered? |
A unified crypto market analysis tool should therefore avoid collapsing these streams into one unexplained number. It should preserve the individual observations, show how they interact, and disclose uncertainty. The practical conclusion is uncomfortable but important: a market can look healthy at aggregate level while an individual token or wallet remains dangerous.
The Case for Live Data Ingestion
Timing can matter more than breadth. A tool that analyzes a cached token snapshot may produce a technically coherent report that no longer describes the market by the time a trader acts. Liquidity can change, creators can sell, wallets can coordinate, and price impact can widen during the interval between collection and execution.
Solana's scale makes this problem difficult to ignore. Recent industry analysis reported approximately $364 billion in Solana DEX volume during Q4 2025, while proprietary automated market makers approached half of network DEX volume at times. The cited Solana market analysis supports an execution-aware approach: a report should capture the observed pool state, not merely repeat token metadata.
Snapshot tools versus execution-aware tools
A static scanner commonly answers whether a token passed checks at a prior observation point. A live system should record the state at the moment of analysis and preserve enough context for another reviewer to reproduce the conclusion.
Useful evidence includes:
- Timestamped liquidity: Record pool liquidity and reserve imbalance at collection time.
- Execution estimates: Calculate slippage and price impact for standardized trade sizes.
- Wallet context: Track holder concentration, creator-linked wallets, and suspicious bundles.
- Reproducibility: Preserve the relevant slot or block range, source accounts, observed prices, and calculation inputs.
The distinction is not academic. A token can retain the same contract address while its tradability changes substantially. A historical volume number may remain visible after the wallets that produced it have stopped trading. A prior liquidity reading may create false confidence after a withdrawal.
Volume needs behavioral validation
A peer-reviewed Management Science study of centralized exchange trading found abnormal first-significant-digit distributions, excessive round-number trade sizes, and unusual transaction-tail behavior on unregulated venues. The study estimated that wash trading averaged more than 70% of reported volume on those exchanges. That finding doesn't mean every large volume print is fabricated, but it does rule out treating volume as trustworthy by default.
A Solana-focused engine should test roundness of trade sizes, first-digit deviations, repeated counterparties or wallet clusters, synchronized reversals, and the relationship between volume and price impact. Those tests should operate at transaction and wallet-cluster level, not only at pool level.
A live report is more valuable when it preserves the evidence that made the decision possible.
The strongest ingestion systems also evaluate themselves. A 24-hour post-flag outcome log can record whether the flagged token experienced liquidity removal, trading suspension, or severe drawdown, then compare results by risk band. That feedback turns a dashboard into a measurable detection system.
Evaluating Alerting and Feedback Systems
Price alerts are easy to implement and often insufficient. A meaningful risk alert should identify a behavioral change, explain the evidence behind it, and remain linked to an outcome that can later validate or challenge the alert.
A trader evaluating an alerting system should inspect the full chain from trigger to review.
Start with the trigger
Ask what caused the notification. “Risk increased” isn't enough. A useful alert might identify creator-linked selling, a change in holder concentration, synchronized wallet activity, a liquidity reduction, or a volume pattern that conflicts with price impact.
The trigger should also include timing. A creator sale shortly after a liquidity increase has a different meaning from an isolated transfer long after the token has established independent ownership. Temporal context helps distinguish acceleration from a static condition.
Inspect the evidence
Opaque scores make comparison difficult. The report should show the observed wallets, transactions, liquidity state, or market behavior that changed the rating. It should also separate direct evidence from interpretation. This makes false positives easier to investigate and prevents a narrative explanation from hiding weak inputs.
The comparison of Solana token alert tools is most useful when it asks whether alerts are evidence-preserving and outcome-aware, rather than whether a platform sends notifications.
Measure what happened afterward
A feedback system needs an explicit observation window. For each flagged token, record the initial risk band and the later outcome, then calculate precision and false-positive rates by category. The objective isn't to make every alert correct. It is to understand which signals work, which signals overreact to normal volatility, and where the engine needs recalibration.
The Management Science findings cited earlier make this especially important because fabricated volume can temporarily distort prices and improve exchange rankings. A system that alerts on volume alone may react to the manipulation it should be detecting. A system that checks counterparties, reversals, trade-size patterns, and price impact has a better chance of separating activity from evidence.
Evaluation standard: Require every important alert to answer three questions, what changed, why it matters, and what happened next.
This approach also improves human review. Analysts can dismiss a warning when the underlying evidence is legitimate market-making, or escalate it when several independent signals move together. The result is not a promise of certainty. It's a transparent process for reducing unexamined assumptions.
Custom Scoring and the Tradeability Gap
Safety and tradability are different scores. A token can have no obvious contract failure and still be a poor trade because liquidity is shallow, attention is fading, or a concentrated holder base can overwhelm the exit market.

The importance of market context becomes clear during regime changes. By late November 2025, meme coins reportedly represented only about 9.2% of Solana DEX volume, approximately $295 million of more than $3.2 billion traded on the network that day. The reported Solana meme-coin activity shift illustrates why token-level safety checks can't establish whether sufficient attention and exit liquidity remain.
Build separate dimensions
A useful scoring model should avoid treating every positive signal as evidence of investment quality. It can separate:
- Contract and rug exposure: Ownership, liquidity control, creator history, and suspicious permissions.
- Behavioral risk: Bundled purchases, insider indicators, repeated wallet clusters, and coordinated reversals.
- Execution quality: Liquidity depth, estimated price impact, slippage, and turnover relative to liquidity.
- Market regime: Whether the broader Solana meme-coin environment supports sustained attention.
- Uncertainty: Missing evidence, stale observations, conflicting signals, and the confidence of the conclusion.
This structure prevents a low rug-risk rating from becoming an accidental buy recommendation. It also makes position sizing analysis more meaningful because price impact depends on the intended trade, not just the token.
Replace static safety with a risk trajectory
The central improvement is temporal. Instead of asking only “Is this token safe?”, the tool should ask whether risk is accelerating during the first minutes and hours. It should compare current liquidity, holder concentration, creator activity, bundled purchases, and trading intensity with token age and recent changes.
A sudden rise in activity isn't automatically validation. In a market where fraudulent tokens can attract coordinated volume, velocity itself may be a warning. The report should state which evidence changed the rating and disclose where false positives remain possible.
Tools such as MemeAssist's Solana analysis methodology illustrate the type of evidence integration required for this use case, combining live on-chain and market observations with a written interpretation. The important design principle isn't the presence of an AI explanation. It's whether the explanation stays anchored to observable inputs.
A trader should leave the report with two answers: Can this token survive and remain tradable? Can I execute the intended position without assuming more liquidity than exists? Those are opportunity questions, not merely safety questions.
Single-Chain Depth Versus Multi-Chain Breadth
Multi-chain coverage sounds thorough, but breadth can conceal shallow analysis. A platform may display balances and basic market data across many networks while failing to inspect the chain-specific behaviors that determine risk on Solana, such as bundled purchases, creator-linked wallets, and rapid liquidity changes.
For a trader focused on Solana meme coins, single-chain depth often has a practical advantage. The analyst can tie liquidity, holder distribution, creator behavior, wallet activity, trading patterns, and historical indicators to one token address in one evidence trail. That reduces the manual handoffs that cause context to disappear.
Choose according to the decision
A multi-chain aggregator makes sense when the research question spans networks. Portfolio managers comparing assets across ecosystems may value a consistent cross-chain view, even if each chain receives less specialized treatment.
A single-chain specialist is more appropriate when the decision depends on chain-specific execution and launch behavior. The relevant test isn't the number of supported chains. It's whether the tool catches the risks that emerge fastest on the chain being traded.
Four outputs should remain distinct
MemeAssist provides four report outputs for Solana tokens:
- Overall Health Score, a high-level synthesis of observed conditions.
- Rug Risk Rating, focused on scam and liquidity-exit exposure.
- Plain-English AI Verdict, translating evidence into an interpretable conclusion.
- Detailed Risk Breakdown, showing the factors that contributed to the assessment.
Those outputs are useful only if the report preserves the underlying evidence and distinguishes observed facts from interpretation. A single score can hide tradeability problems, while a detailed breakdown can show why a token is unsafe, difficult to exit, or exposed to a weak market regime.
The strongest selection criterion is therefore not “Does this tool cover ten chains?” It's “Does it measure the risk vectors that drive my actual decision?” For Solana traders, specialized evidence can be more valuable than broad but superficial coverage. For cross-chain researchers, breadth may justify accepting less chain-specific detail. The correct choice follows the market and the decision, not the feature count.
MemeAssist offers live Solana token reports combining liquidity, holder, creator, wallet, trading, and historical risk signals with an Overall Health Score, Rug Risk Rating, AI Verdict, and Detailed Risk Breakdown. Use MemeAssist to examine a token's current safety and tradeability evidence before treating price or volume as confirmation.