Crypto Screener Guide: Filters, Metrics and Workflow
You're looking at a list of new Solana tokens before the day really starts, and most of them will never deserve a second look. You don't need a tool that tells you what to buy. You need a crypto screener that removes the obvious dead ends, tests whether you can get out, and leaves you a shortlist small enough to check properly.
Table of Contents
- What a Crypto Screener Does and Why It Matters
- Key Filters and Metrics Every Screener Should Show
- Why Volume and Liquidity Need Context
- Tuning Thresholds Before the First Scan
- How to Read Signals Without Overtrusting Them
- Screen Workflow and Your First Daily Run
What a Crypto Screener Does and Why It Matters
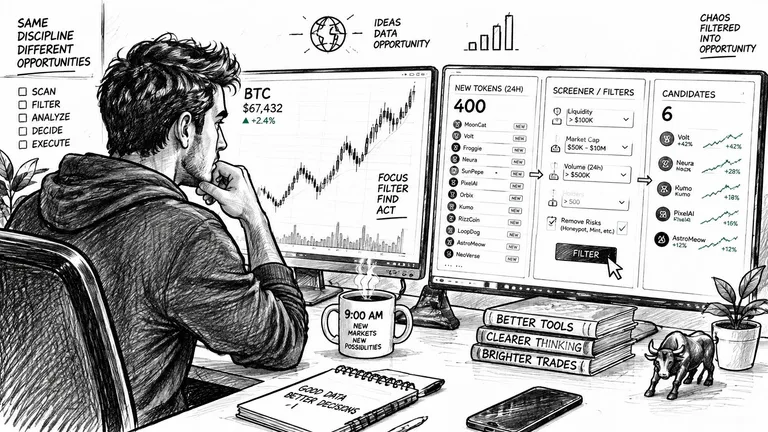
Say you open your charts at 9 a.m. and find 400 new tokens launched overnight. That figure is a worked scenario, but the problem is real. You can't inspect every contract, pool, and creator wallet by hand, so you set rules first and let the screen do the sorting.
A crypto screener works like a job board filter. You'd narrow listings by location and salary before reading any description in full. Here, you narrow tokens by liquidity, age, holder spread, and permissions before you open a single chart.
Two Types That Answer Different Questions
Exchange and charting screeners scan listed pairs for price change, volume, moving averages, and volatility. They're useful when you're comparing established pairs and timing entries. They don't tell you who controls a token's supply.
On-chain screeners read blockchain data directly, including contract permissions, holder distribution, liquidity pools, and creator wallets. That matters for Solana meme coins because a token can trade long before any exchange lists it. The risk sits in the pool and the wallets, not just the price line.
Why Screening Is a Sorting Job
Screening is needed because harmful activity is large in money terms but small as a share of the whole market. The Chainalysis 2025 Crypto Crime Report estimated illicit cryptocurrency addresses received at least $40.9 billion during 2024, yet illicit activity represented approximately 0.14% of attributed on-chain transaction volume.
So a good screen doesn't label every transaction suspicious. It surfaces the small share that needs investigation inside a much larger legitimate market. It also means a broad market figure can't clear an individual token for you.
Practical rule: A screener shortlists, it doesn't decide. Pick the type that matches the assets you actually trade.
Choose an exchange screener for listed pair timing. Choose an on-chain screen when you're judging new Solana launches. Many traders need the second one first, because that's where exit and control risks appear earliest.
Key Filters and Metrics Every Screener Should Show
Start with seven filters and tune them to your strategy. Each row shows what the filter measures, the warning sign to look for, and why it matters. Treat warning signs as prompts to check further, not as fixed cutoffs that settle the question.
| Filter | What It Measures | Warning Sign | Why It Matters |
|---|---|---|---|
| Liquidity depth (USD) | Value available to buy and sell in the main pool | Shallow or shrinking pool | Decides whether you can exit at a fair price |
| Holder concentration | Share of supply held by the largest wallets | A few wallets control most supply | One large sale can move the price sharply |
| LP lock or burn status | Whether liquidity-provider tokens are locked or burned | Unlocked, short lock or unknown | Controls whether liquidity can be withdrawn |
| Mint and freeze authority | Whether the creator can mint new supply or freeze accounts | Authority still active | The creator can change supply or block sales |
| Creator wallet history | Past launches and recent transfers from the creator | Earlier tokens abandoned, recent large transfers | Shows how the creator has behaved before |
| Volume to liquidity ratio | Trading turnover relative to pool depth | Very high turnover with few unique buyers | Can point to wash trading |
| Last trade time and token age | How long the token has existed and when it last traded | No trades in the last 24 hours | Shows whether a real market still exists |
Group the Rows by Risk
Exit risk comes from liquidity depth and LP lock or burn status. A token you can't sell without heavy slippage fails before any upside matters. Put these first in your reading order.
Control risk covers mint and freeze authority plus holder concentration. Active authority means the creator can still change the rules. Concentrated holders mean a small group can sell into you and move the price in one clip.
- Creator risk: Past launches and recent transfers show whether the creator tends to stay, leave, or move supply around.
- Market risk: Volume to liquidity and last trade time show whether trading looks broad and current, or thin and stale.
A full on-chain analysis evaluates six signal categories, namely liquidity, holder distribution, creator behaviour, wallet activity, trading patterns, and historical risk indicators. Each row in the table maps to one of those categories, so you're not collecting random metrics. You're building evidence under named headings.
The Survival Check Most Screens Skip
Clean contract settings don't guarantee a working market. A token can have revoked authorities and still be a poor trade because nobody is trading it anymore. Cryptonews reporting on Bitquery data tracked 8,984,141 Pump.fun tokens launched between November 1, 2025 and October 7, 2026, and 79% were not traded again after launch day.
That's why last trade time belongs beside liquidity, not buried under extras. Ask whether the token merely exists right now, or whether there's evidence of an actual market that may still be there when you sell.
Save a minimum template before you experiment further. Keep liquidity, authority status, holder concentration, last trade time, and creator history on every run. You can add filters later, but don't drop the exit and control checks to make room.
Why Volume and Liquidity Need Context
High volume looks like demand, which is exactly why manipulators fake it. Reported turnover can be manufactured with repeated swaps that create activity without bringing in new buyers. You have to ask who is trading, where, and against how much real pool depth.
The image below shows the comparison you should make on every token, reported flow against the liquidity that supports it.
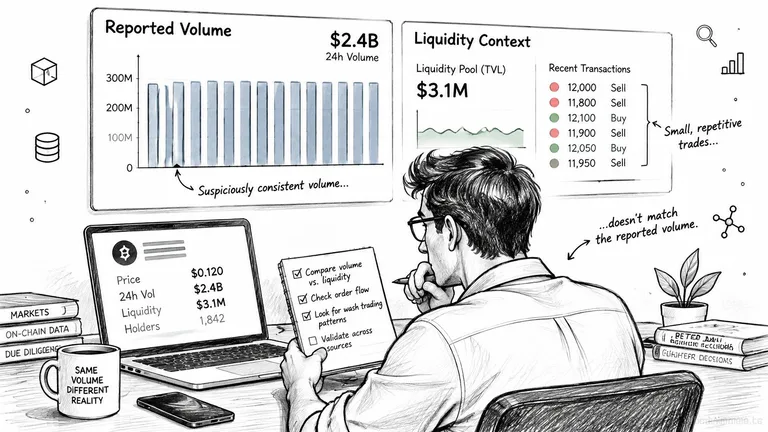
A Management Science study covering 29 centralized exchanges found abnormal first-digit distributions and excessive transaction-size rounding on unregulated venues, and its estimates indicated wash trading averaged more than 70% of reported volume on those exchanges. Those are centralized exchange findings, not a Solana verdict. They still teach the right habit, which is to verify volume instead of admiring it.
Patterns to Look For on Solana
- Same cluster on both sides: Linked wallets repeatedly buy and sell to each other.
- Flat unique buyers: Turnover climbs while the count of distinct buyers barely moves.
- Stable price under heavy trading: Price barely shifts despite turnover that should move a thin pool.
- Synchronized trade sizes: Repeated round amounts appear in a regular rhythm.
- One pool does everything: Activity concentrates in a single pool rather than spreading across venues.
Use a weighted anomaly score instead of a yes or no label. Give one point for each pattern above. Then double the points when the pool is shallow relative to volume, because artificial trades move price more when real trading is thin.
The short video below is worth watching before you score your first token, so you can see the order flow context in motion.
Liquidity adjustment changes the meaning of the same number. Say, as an illustration, a token shows 500,000 in volume on a 20,000 pool with very few buyers. That scores high. The same illustrative volume on a 2 million pool with hundreds of buyers scores low, because broad participation and depth explain the turnover more plausibly.
A big volume number with no new buyers and no price movement isn't strength. It's a question you haven't answered yet.
Check the pool itself with a dedicated Solana liquidity checker when the ratio looks stretched. Record the score and the specific reason it changed. Your next check then starts from evidence, not from a memory that a token once looked busy.
Tuning Thresholds Before the First Scan
Set your thresholds before the first scan, so every run uses the same rules. If you adjust filters while looking at results, you'll bend the rules toward tokens you already like. Write the settings down and save them as one named screen.
Start With the Exit
Work backward from the position size you intend to exit. Reject any pool that can't absorb that sale at slippage you'd accept. This makes your liquidity floor personal, because a pool that's deep enough for a small test trade may be far too shallow for your normal size.
Set the token age window next. Use a short window when you want fresh launches, and a longer one when you want to observe tokens over several days. Then choose three to five filters that fit your style and keep them steady across runs.
Three Misreads to Avoid
- One clean filter offsets a failed one: It doesn't. Locked liquidity and revoked authorities don't cancel a holder concentration failure.
- No warning means safe: It doesn't. A screen only sees the data it reads, so missing warnings reflect limits as well as strengths.
- One snapshot is enough: It isn't. Compare each filter across at least two checks before you accept the result.
Treat each warning sign as a prompt for checking, not a fixed cutoff. Save the final rule set so tomorrow's run is comparable to today's. Consistency is what turns casual scanning into a record you can learn from.
How to Read Signals Without Overtrusting Them
A screener output is a probability, not a verdict. That's hardest to remember in the first minutes of a launch, when price moves fast and you feel pressure to decide. Early signals are informative, but they're also fragile.
A 2026 academic study of Solana tokens assembled a dataset of 6.4 million Solana tokens over seven months and reported most displayed rug-pull characteristics within one hour. It also found gradient-boosting models could detect potential rugs using only the first five minutes of trading data.
Five minutes still means small samples, concentrated wallets, unstable prices, and short histories. A model can flag risk early without proving what a token will do next. Your job is to judge how mature the signal is.
A Signal Maturity Checklist
- Sample size: How many trades and distinct wallets sit behind the reading?
- Observation window: Are you judging minutes, an hour, or a full day?
- Persistence: Did the suspicious behaviour continue after the first burst?
- Holder trend: Is concentration falling as new buyers arrive, or staying locked in a few wallets?
- Creator-linked activity: Are creator or linked wallets still moving supply?
Use a simple decision rule. A strong early warning justifies avoiding the token or waiting. A weak warning that doesn't persist is often launch noise, so let time and new trades clarify it.
The table below pairs common combinations with a likely reading and the next check that resolves the ambiguity.
| Signal Combination | Likely Reading | Next Check |
|---|---|---|
| High volume with few unique buyers | Possible wash trading | Check whether the same wallet cluster appears on both sides of swaps |
| Strong early warning from the first five minutes | Launch noise or a real risk | Wait for the warning to persist at one hour and 24 hours |
| Adequate liquidity with top wallets holding most supply | Exit risk if large holders sell | Simulate a fixed-size sale and estimate slippage |
| Clean authorities but no trade in 24 hours | Market is fading | Check time since last trade and liquidity persistence |
| Rising price with flat holder count | Price may be driven by a small group | Track holder growth and concentration over several checks |
If the first row appears, a focused guide on how to detect wash trading on Solana helps you separate linked wallet churn from real demand. Review flagged tokens against what happened over 24 hours, including liquidity removal or abnormal selling. That feedback tells you which warnings deserve more weight in your own screen.
Confidence check: Conditional trading scenarios in a report are analysis scenarios, not trading instructions. They don't predict a certain outcome or guarantee execution at the displayed price.
Read combinations, not isolated flags. Two moderate warnings pointing at the same risk usually matter more than one dramatic number with no support behind it.
Screen Workflow and Your First Daily Run
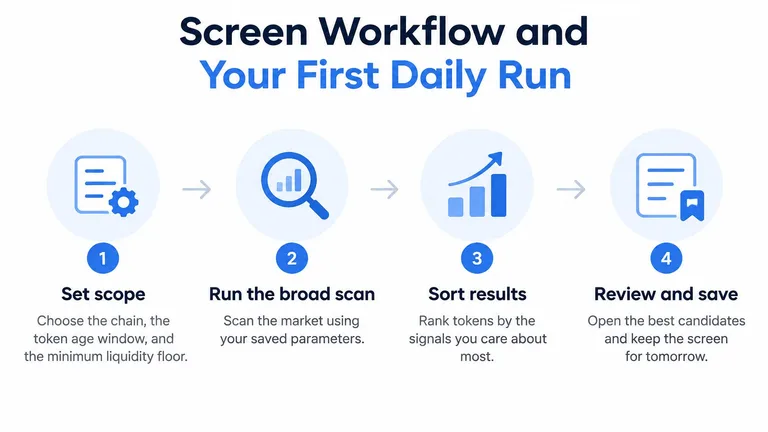
Run the same sequence each time you use your saved screen. Order matters because cheap, decisive checks should remove weak tokens before you spend time on slower judgment calls. Exit and control tests come early for a reason.
The workflow diagram below compresses the routine into four stages, from setting scope to saving what you learned.
The Eight Steps in Order
- Set scope: Choose the chain, the token age window, and your minimum liquidity floor.
- Run the broad scan: Sort by liquidity, then by age, so empty pools drop out first.
- Apply authority checks: Confirm mint and freeze status, then LP lock or burn status.
- Check holder concentration: Look for linked wallets sitting among the top holders.
- Review creator history: Look for earlier launches that were abandoned and for recent large transfers.
- Test the exit: Estimate slippage for a fixed sale against the current pool before you consider buying.
- Check trading survival: Confirm time since last trade and whether liquidity has held since launch.
- Log every decision: Record each keep or reject with its reason, then re-check survivors after 24 hours.
The exit test deserves emphasis because liquidity can disappear quickly. An SEC litigation release describing a rug-pull mechanism explains LP-token holders can withdraw liquidity without warning, and the alleged conduct in that enforcement case was associated with an approximately 12% price decline. Simulating your sale in advance won't prevent withdrawal, but it shows whether today's pool can handle your size at all.
What the Funnel Looks Like in Practice
Say a scan returns 40 new tokens as a worked example. In that example, 18 fail the authority check, 9 fail holder concentration, and 5 fail the exit test. You're left with 8 tokens for the 24-hour re-check, which is a list you can inspect.
That funnel is the whole point of screening. You haven't found 8 buys. You've earned 8 candidates that survived basic exit, control, and survival tests.
Reject fast on hard failures, then spend your attention slowly on the few tokens still standing.
Escalate Only the Survivors
Use free first-pass tools for the broad scan. We offer free tools including Market Radar, Solana Token Analyzer, Contract Checker, Liquidity Checker, Honeypot Checker, Risk Score, Rug Checker, Rug Creator Registry, Live Rankings, Trending Tokens, Token Directory, Recent Analyses and Risk Watchlist, so the Contract Checker, Liquidity Checker, Honeypot Checker, and Rug Checker can cover the first pass at no cost.
For a survivor that still interests you, a full token analysis with conditional Trade Setup costs $0.20. It adds an Overall Health Score, Rug Risk Rating, AI Verdict, and Detailed Risk Breakdown, plus entry, stop-loss, and target levels only when price structure supports them. Read those levels as scenarios for analysis, not as promised execution prices.
If you're building your sourcing routine as well as your filters, our guide on how to find new Solana memecoins early pairs well with this workflow. Run your saved screen tomorrow morning, log the first decisions, and re-check the survivors before you add any new rules. A week of logged rejects teaches you more than a week of scrolling charts.
Run your first screen with the exit and survival checks switched on, then escalate only the survivors to a full Solana report with a health score, rug risk rating, and a detailed evidence breakdown. Visit MemeAssist to start with the free checkers, save your shortlist, and test each candidate before you trade it.
Topics: crypto screener, crypto screener filters, token screener, Solana screener, on-chain screener
Informational only, not financial advice. Meme coins are extremely high-risk.
All articles