Crypto Wash Trading Explained: How to Spot Fake Volume
Crypto wash trading explained with real data, on-chain detection signals, and case studies. Learn how to spot fake volume on Solana meme coins and avoid
Published
Updated
Wash trading is the practice of buying and selling an asset to create artificial volume without changing real ownership, and documented estimates have placed up to roughly 77.5% of volume on unregulated crypto exchanges in this category. For a Solana meme-coin trader, the important question isn't how busy a token looks, but whether independent buyers are committing capital that stays in the market.
A transaction can be real on chain while the demand it appears to represent is manufactured. That distinction changes how you read a trending token, assess a breakout, and decide whether you'll be able to sell.
Table of Contents
- Why Reported Crypto Volume Cannot Be Trusted
- What Wash Trading Actually Is
- Why People Wash Trade Crypto in the First Place
- A Real Case Study in Manufactured Volume
- How to Detect Wash Trading on Chain
- When Wash Trading Actually Hurts Traders
- A Practical Pre-Buy Workflow for Solana Meme Coins
- Putting It All Together
Why Reported Crypto Volume Cannot Be Trusted
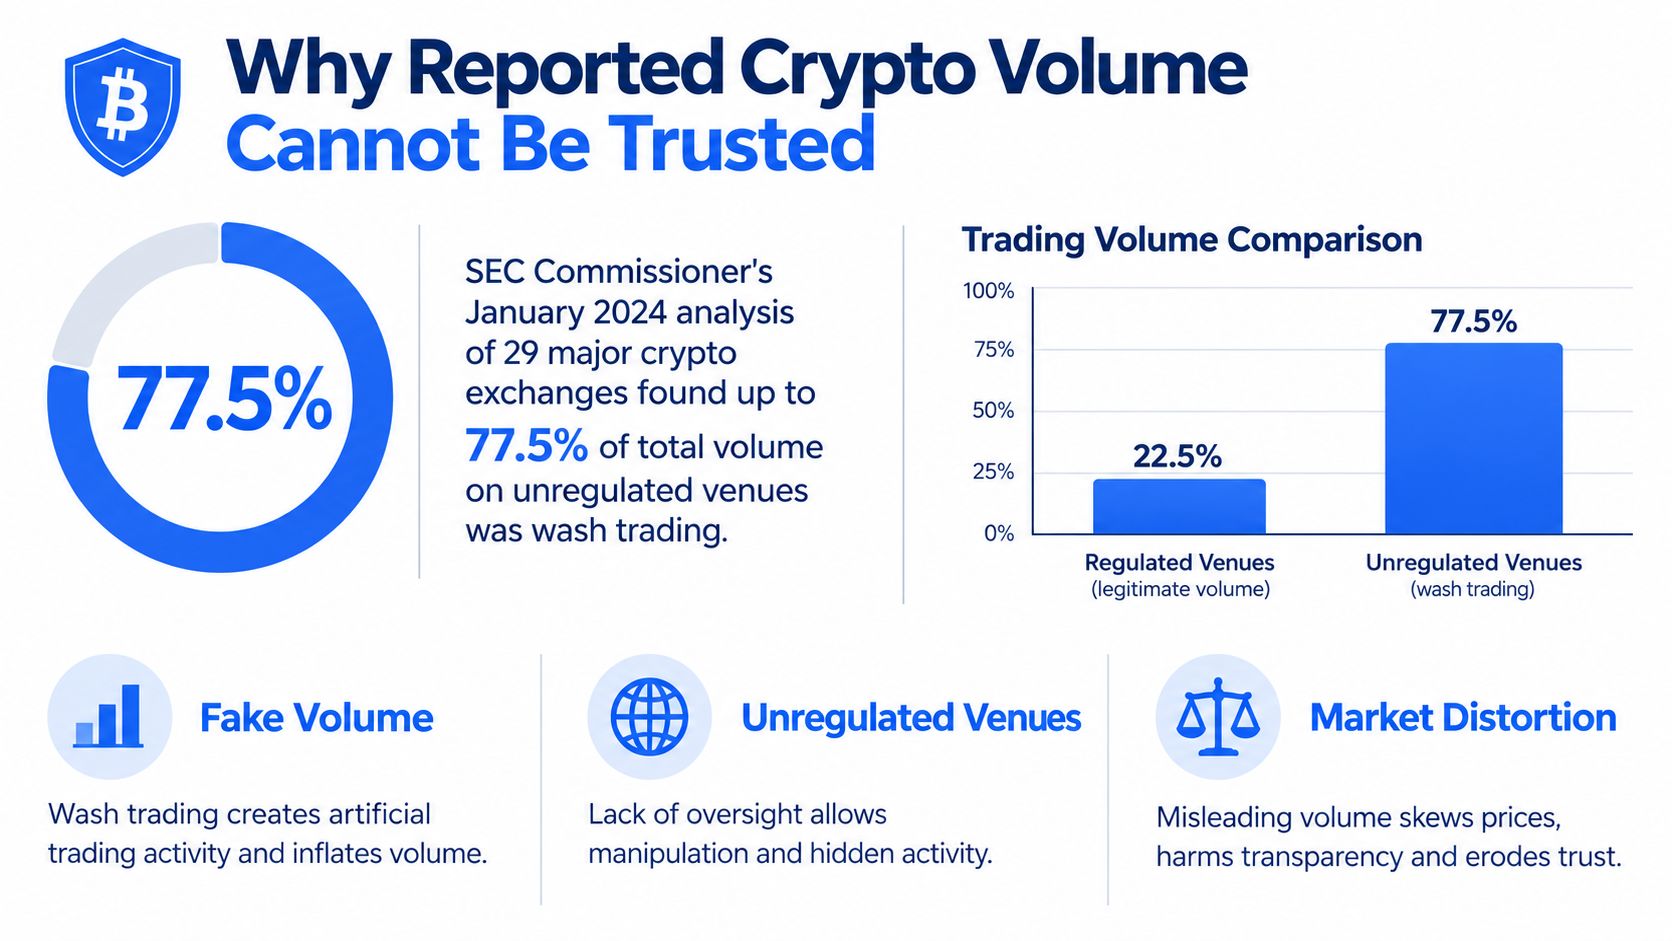
In her January 2024 statement, SEC Commissioner Caroline Crenshaw cited an analysis of 29 major crypto exchanges estimating wash trading at as much as 77.5% of volume on unregulated venues, alongside an analysis of 157 exchanges estimating that roughly 51% of reported daily Bitcoin volume was likely bogus (SEC statement on spot Bitcoin products). These were analytical estimates, not findings that every flagged transaction had been individually proven fraudulent.
The scope matters. Those figures aren't measurements of Solana meme-coin pools, and applying them directly to a newly launched token would be unjustified. They establish a narrower but important point: displayed volume isn't automatically economically meaningful activity.
The visual below summarizes the headline estimate. Read it as an estimate concerning unregulated exchanges, not all crypto trading.
The Decisions Inflated Volume Can Corrupt
A trader who interprets turnover as demand can make several connected mistakes:
- Entry timing: A burst of coordinated trading can look like independent buyers discovering the token. Entering on that assumption means buying an activity signal whose underlying participants haven't been checked.
- Position sizing: Heavy turnover may encourage a larger position even when the pool has little usable liquidity.
- Exit planning: Historical volume can suggest that buyers will absorb a sale. Recycled capital doesn't establish that those buyers exist.
These are calibration failures, not merely failures to identify a scam. Even without proving manipulation, a trader can recognize that the displayed metric doesn't support the proposed trade.
The practical response is to compare volume with unique buyers, net holder growth, liquidity depth, and wallet-level inventory changes. Each asks a different question: Is participation broadening? Are positions persisting? Can the pool absorb an exit? Are active traders taking meaningful exposure?
A busy chart deserves investigation, not an automatic confidence upgrade.
What Wash Trading Actually Is
Consider a marketplace vendor who repeatedly buys merchandise from their own stall. Receipts accumulate, passersby see activity, and the stall appears popular, but the vendor hasn't acquired an independent customer. Crypto wash trading follows the same economic logic, even when the purchases pass through several wallets.
The defining issue is economic ownership, not whether a transaction occurred. A blockchain record establishes that addresses exchanged assets. It doesn't, by itself, establish that separate people made independent investment decisions.
Activity Isn't the Same as Manipulation
Legitimate market making can also produce frequent buying and selling. A market maker manages inventory and seeks trading opportunities while interacting with independent demand; rapid two-sided activity alone doesn't establish self-trading. The centralized-exchange research described in the NBER working paper on crypto wash trading uses behavioral anomalies rather than labeling frequent traders suspicious.
| Observation | Plausible legitimate explanation | What deserves further investigation |
|---|---|---|
| Frequent buys and sells | Inventory management | Linked participants repeatedly recycling exposure |
| Similar trade amounts | Automated execution rules | Matching amounts alongside shared funding and circular flows |
| Low ending inventory | A trader closing positions | Repeated turnover without meaningful exposure across a connected group |
On a meme-coin DEX, address separation makes the ownership question harder. An actor can distribute activity across wallets, while bots can execute genuine transactions that reveal little about lasting demand. In an automated-market-maker pool, traders also interact with the pool rather than necessarily trading directly with identifiable opposing wallets.
That means a buyer-seller pairing should be interpreted through funding and asset flows, not assumed from adjacent transactions. The useful investigative unit is often a wallet cluster observed over time, rather than an isolated address.
Wash trading is a relationship pattern across wallets and time, not a transaction pattern you can reliably identify from speed alone.
This distinction prevents a common analytical error: treating evidence of automation as evidence of deception.
Why People Wash Trade Crypto in the First Place
Before judging suspicious activity, identify who benefits from the volume being high. The incentive can tell you whether to investigate rewards, visibility, or a potential distribution event.
Reward and fee farming is the most direct mechanism. If a venue distributes benefits according to trading activity, coordinated participants may have a reason to generate transactions without acquiring lasting exposure. The NFT marketplace findings discussed below show why volume-linked incentives deserve particular scrutiny.
Follow the Economic Benefit
The other motivations don't require a direct payment for each trade. They depend on how observers interpret activity.
- Ranking manipulation: Fabricated volume can improve an exchange's apparent standing. For a DEX token, the analogous concern is whether activity-based discovery surfaces make coordinated turnover look like independent interest. Don't assume a particular feed uses volume without checking its methodology.
- Social proof: A newcomer may interpret a busy market as evidence that other traders have already validated the token. The manipulator benefits if that interpretation attracts genuine buyers.
- Exit preparation: Someone holding supply may benefit from making a market appear more active before selling. This is a risk hypothesis to test against wallet behavior, not a conclusion supported by volume alone.
The exchange research gives the visibility incentive a substantial context: a Cornell summary of NBER research reported estimated fake trading exceeding 70% on unregulated exchanges, representing over $1 trillion in monthly transaction volume across the study period and the examined major trading pairs. Those estimates describe the studied venues, not a universal rate for every asset or chain.
A useful distinction is whether the suspected operator earns from the transactions themselves or from the audience those transactions attract. Reward farming can be profitable without convincing an outside buyer; visibility-driven manipulation depends on someone mistaking manufactured activity for demand.
For a Solana token, ask what changes if its displayed volume rises. If insiders, reward recipients, or promoters benefit while independent ownership barely changes, the incentive deserves investigation.
A Real Case Study in Manufactured Volume
The NFT marketplace research offers a concrete example of apparent demand becoming concentrated among repeat actors. Researchers identified 12,413 confirmed wash-trading activities, representing approximately $3.406 billion in artificial volume; more than 84% of LooksRare's volume was attributed to wash trading, and approximately $3.318 billion, or 97.41% of the study's identified wash-trading volume, occurred there (academic analysis of NFT marketplace wash trading).
The concentration within the identified activity is especially revealing: 27.16% of accounts involved in wash trading participated in 72.93% of detected activity, according to the same study. That denominator matters. These weren't percentages of every account using the marketplaces, and they shouldn't be described that way.
What the Concentration Actually Shows
The important observation is not that a marketplace displayed large transaction totals. Repeat participants accounted for a disproportionate share of the detected artificial activity. Counting transactions without examining who generated them would conceal that concentration.
This is also where careful narration matters. The findings support an explanation centered on volume-linked incentives and repeat trading; they don't justify inventing a precise wallet-by-wallet sequence or claiming every participating account had the same motive.
| Surface-level reading | Evidence-based reading |
|---|---|
| Large turnover suggests widespread interest | Participation must be examined separately from turnover |
| Many transactions imply many decisions | Repeat actors can generate disproportionate activity |
| Rewards indicate active users | Incentives may encourage activity that doesn't represent independent demand |
The lesson for meme-coin screening isn't that NFT marketplace percentages transfer to Solana. They don't. The lesson is that participant concentration can invalidate the interpretation of an otherwise impressive headline metric.
A token analyst should therefore separate two questions: how much trading occurred, and how many economically independent participants generated it. Neither answer can substitute for the other.
Before accepting a pool's volume as evidence of popularity, ask a more revealing question: Who profits from this volume being high?
How to Detect Wash Trading on Chain
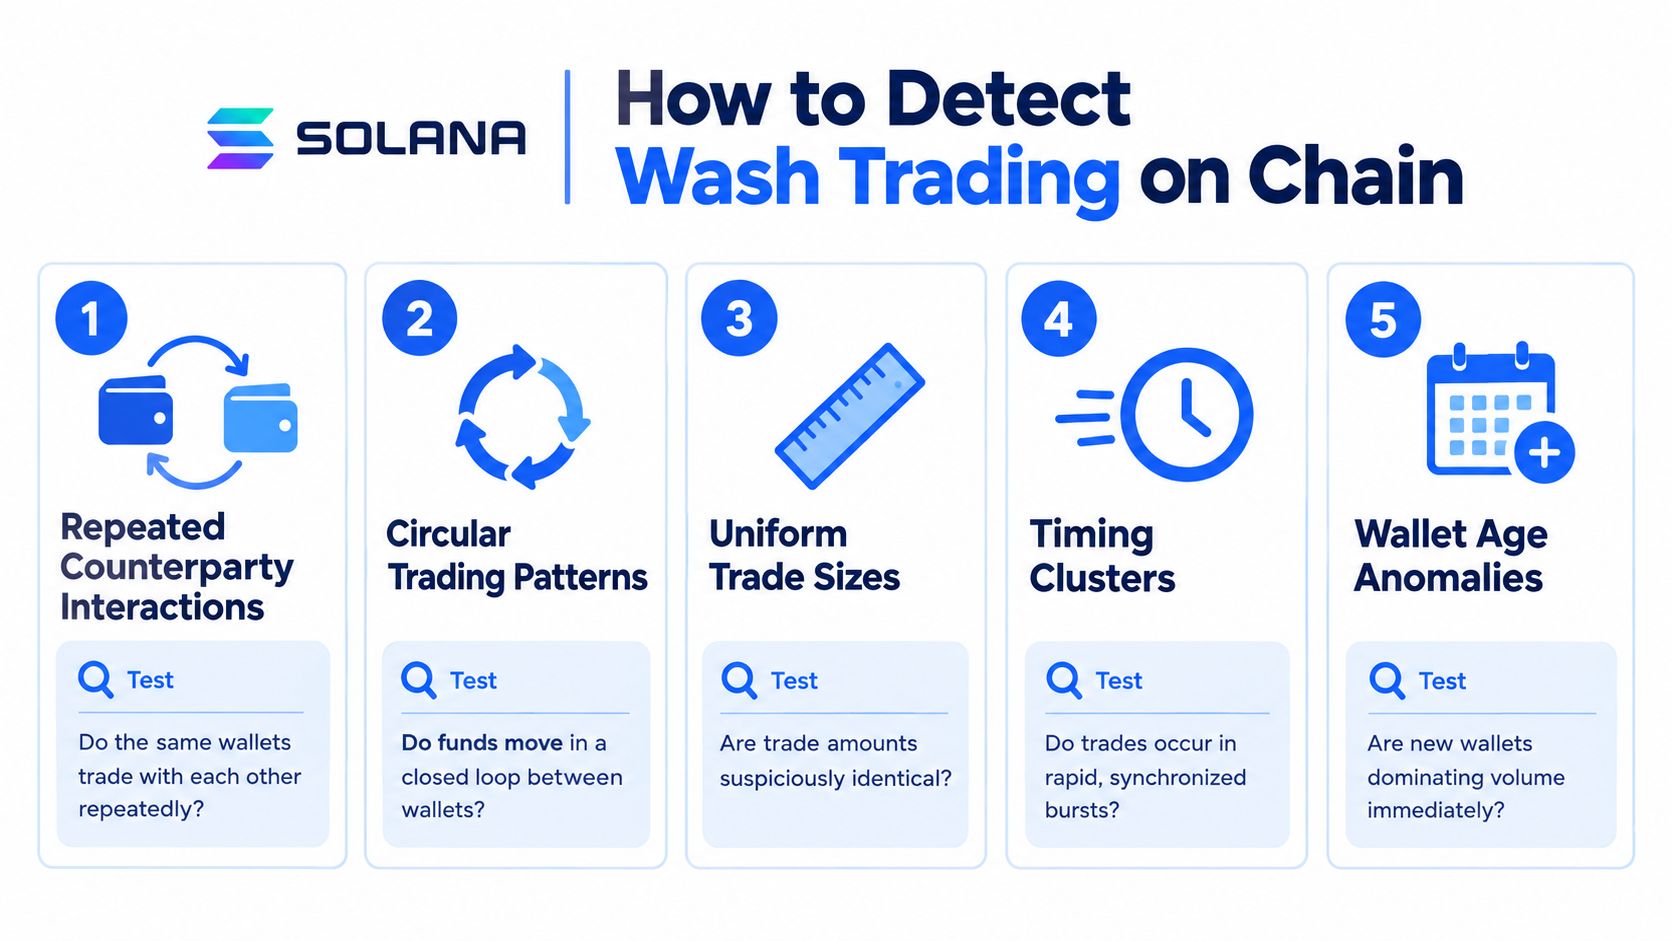
Start with an evidence bundle, not an accusation. Research on cryptocurrency volume inflation combines reported activity with on-chain measures and behavioral tests, including trade-size distributions and transaction relationships. Its practical lesson is that several aligned anomalies are more informative than a high trade count.
Use the checklist below as an investigation prompt, not a verdict. Newly created wallets or uniform amounts need corroboration.
Tests That Deserve Attention
- Repeated relationships: Do the most active addresses repeatedly connect through transfers, funding, or recycled proceeds? For pool trades, trace the assets rather than assuming consecutive traders are direct counterparties.
- Synchronized funding: Did active wallets receive capital from overlapping sources and then begin trading together? Shared funding is a lead, not proof of common control.
- Short holding periods: Do wallets repeatedly unwind exposure shortly after acquiring it? Compare that behavior with their funding and subsequent asset flows.
- Near-zero net inventory change: Does a cluster generate substantial turnover while ending with little change in its combined holdings? Examine the cluster, not just individual wallets.
- Recurring trade sizes: Are similar amounts repeated alongside synchronized timing or circular transfers? Automated sizing alone is weak evidence.
- Activity without breadth: Is volume expanding while unique active buyers, holder growth, and liquidity remain weak? Investigate whether apparent momentum reflects new participation.
The guide to Solana wallet clusters is a useful companion when interpreting address relationships. Clustering helps reveal capital that appears independent at the address level but repeatedly returns through a connected group.
Repeat the analysis across observation periods. A brief burst can be ambiguous; persistent coordination alongside limited inventory change is harder to explain as unrelated activity.
Detection limit: Public wallet relationships support confidence levels. They don't automatically reveal beneficial ownership or intent.
For a complementary visual explanation, use the embedded video alongside the wallet-level checks.
High turnover combined with weak participation and circular flows is a warning worth acting on. It still isn't a standalone finding of fraud.
When Wash Trading Actually Hurts Traders
Suspected wash trading doesn't imply the same outcome in every market. Research examining historical Mt. Gox activity found wash trades represented about 2.1% of transactions and 1.4% of traded volume, with limited effects on returns and liquidity (research on wash trading and market quality). That finding doesn't make manipulation harmless, but it challenges the assumption that every instance creates immediate, severe price damage.
For a meme-coin trade, separate the harm into distinct mechanisms. Each requires different evidence and a different response.
Match the Warning to Your Exposure
| Risk | What the trader may misunderstand | Relevant response |
|---|---|---|
| Discovery distortion | Popularity and breadth of demand | Reassess whether the token merits attention at all |
| Temporary slippage or price distortion | Whether a burst represents durable buying | Check executable liquidity and avoid chasing unexplained activity |
| Structural exit risk | Whether counterparties and liquidity will remain available | Investigate supply control, liquidity control, and cluster exposure |
Discovery distortion can harm a trader before execution becomes a problem. The trader chooses the asset because activity appears to validate it, even though the same participant group may be generating that activity. The error is in selection.
Temporary execution risk is different. A coordinated burst may encourage entry at conditions that don't persist, but the severity depends on the pool's depth, the trader's order, and what genuine participants do afterward. Check those conditions with a Solana liquidity checker, rather than inferring sellability from turnover.
Structural exit risk deserves the strongest response. If the suspected trading group also controls substantial supply or liquidity, the issue extends beyond misleading popularity: the same actors may determine whether the trader can exit on acceptable terms.
The practical distinction is between an unreliable signal and an unreliable exit. A token can have questionable activity without establishing the latter, while concentrated control and weak liquidity can make the latter serious even before manipulation is proven.
Your holding horizon matters, too. An activity burst relevant to a short-term entry may tell you little about whether independent demand will remain when you intend to sell.
A Practical Pre-Buy Workflow for Solana Meme Coins
Before buying, assemble a report that connects activity with ownership and execution conditions. Manual wallet tracing and pool inspection remain valid approaches; MemeAssist is another option, generating on-demand Solana reports from live on-chain and market data with an Overall Health Score, Rug Risk Rating, AI Verdict, and Detailed Risk Breakdown.
The report view below illustrates the kind of consolidated evidence a trader should inspect rather than relying on a score alone.

Read the Outputs as Different Questions
- Start with the Overall Health Score: Use it to prioritize investigation. It's a summary, not permission to buy.
- Read the Rug Risk Rating beside it: Examine whether ownership and liquidity risks conflict with the broader assessment.
- Test the AI Verdict: Look for a plain-English explanation connecting the observed evidence to the warning. An unexplained label isn't enough.
- Verify the Detailed Risk Breakdown: Inspect the checks underlying the summary and decide whether they support your intended position.
Consider a hypothetical report with a favorable health assessment but an elevated rug warning. There's no necessary contradiction: acceptable trading conditions can coexist with concentrated ownership. Don't average the labels into reassurance; determine which evidence could invalidate your exit plan.
Cross-check liquidity depth, holder distribution, creator behavior, wallet activity, trading patterns, and historical risk indicators. Bundle and insider indicators belong in that comparison because apparent wallet diversity may not represent independent exposure. Review public evidence where available, and distinguish observed relationships from inferred coordination.
Post-flag outcome tracking provides another check on interpretation. Follow whether genuine participation persists, liquidity remains usable, and suspicious clusters reduce exposure; a static warning can't answer those evolving questions.
Use the guide to buying Solana meme coins safely to place this review within a broader pre-trade process. If you can't explain the conflict between the headline assessment and the underlying evidence, postpone the trade.
Putting It All Together
The useful question isn't whether a token has suspicious transactions. It's whether the evidence undermines the specific assumption your trade depends on: independent demand, stable execution conditions, or a viable exit.
That gives crypto wash trading analysis a more practical purpose than producing a fraud label. You can decide that evidence is too weak to support a position without claiming you've identified the operator or proven intent.
Turn Uncertainty Into a Trading Decision
Use this final check before committing capital:
- Normalize participation: Compare turnover with unique buyers and retained ownership, not just transaction totals.
- Check holder growth: Determine whether newcomers are staying exposed or whether activity ends in repeated round trips.
- Verify wallet independence: Investigate relationships among dominant participants before treating address count as market breadth.
- Inspect price impact: Assess the proposed order against actual liquidity, including the conditions required for your eventual sale.
- Require explanations: Prefer evidence that resolves anomalies over assurances that dismiss them.
The highest-concern setup combines suspicious activity with concentrated holders, weak liquidity, recurring coordination, and declining organic participation. In that situation, several independent parts of the trade thesis are unsupported at once. A compelling chart doesn't resolve any of them.
Conversely, an isolated anomaly with a plausible explanation shouldn't automatically become a permanent scam label. Confidence should change as wallet behavior, ownership, and liquidity change.
Trading discipline: You don't need certainty about manipulation to decline a trade whose exit assumptions you can't verify.
The deeper insight is that detection and action have different thresholds. Proving coordinated self-trading requires strong evidence; deciding that a position is too difficult to evaluate requires much less. Retail traders don't have to solve attribution before protecting their capital.
In meme-coin markets, the report you read before buying matters more than the chart you watch afterward. Make the entry conditional on evidence you understand, not activity you hope is genuine.
MemeAssist offers live Solana token risk reports that bring wallet activity, trading patterns, holder concentration, and liquidity evidence into a single review. Visit MemeAssist before your next purchase, analyze the token address, and check whether its apparent volume is supported by independent participation and usable exit liquidity.