Levels of Risk for Solana Meme Coins: A Signal Guide
In 2024, 41,557 cryptocurrency investment-scam complaints reported $5.8 billion in losses, according to the U.S. Congressional Research Service summarizing FBI IC3 data. None of those complaints came with a warning label attached at the moment of purchase. The money moved first, and the label arrived later, usually in a support forum.
That gap between a rating and an outcome is where most discussions of levels of risk go wrong. A tier describes the evidence in front of you at a specific moment. It doesn't forecast the next hour, it doesn't price volatility, and it doesn't promise that a clean structure stays clean once a large holder decides to leave.
Read a risk level as three things stacked together: how likely a malicious event is, how much of your position it would destroy, and whether you can still get out when it happens. With those three in view, the label stops being a verdict and becomes a decision input.
Table of Contents
- Four Risk Levels and the Signals Behind Each
- How Likelihood and Impact Combine into a Score
- Liquidity Checks That Show Whether You Can Exit
- Holder Concentration and Coordinated Wallets
- How Long a Risk Rating Stays Valid
- Misreadings That Make Low Risk Look Safe
- Check the Risk Tier Before Your Next Buy
Four Risk Levels and the Signals Behind Each
| Tier | Typical signal pattern | Likely outcome for a buyer | Action before buying |
|---|---|---|---|
| Low | Deep pool relative to planned position, spread-out holders, no synchronized wallets | Price moves within normal volatility | Size the position within what the pool can absorb |
| Moderate | Thin pool for planned size, one or two concentrated holders, volume rising faster than holders | Noticeable slippage on exit | Reduce size and recheck after the first hours |
| High | Liquidity removed or a lock covers only part of the pool, clustered wallets, volume spikes after launch | Exit may cost heavy slippage or be blocked | Avoid, or wait for the evidence to improve |
| Critical | Creator or bundled wallets control liquidity and most supply, sell pressure draining the pool | Exit may be impossible | Do not buy |
Read the tiers as a ladder of exit difficulty, not a scale of badness. At Low, a sell of your planned size moves the price within normal volatility, because the pool is deep relative to the position you intend to trade. At Moderate, the pool is thin for that size and one or two holders control a large share of supply, so your exit depends on their patience. At High, liquidity has changed since launch or a lock covers only part of the pool, which means the exit you modelled an hour ago may no longer exist. At Critical, a small group of creator or bundled wallets controls both the supply and the liquidity, and there's no exit left to price.
The tier comes from the interaction of signals, never from one reading. Deep liquidity doesn't neutralize a creator wallet that still holds most of the supply, and a clean holder chart doesn't repair a pool that has been drained since launch.
A tier you can't explain is a tier you can't act on. Every rating should point back to the specific measurement that produced it.
Tiers also move. Say a token screens as Low at launch: the pool is deep relative to your size, holders are spread out, and nothing trades in sync. Two hours later a top-ten wallet transfers a large balance into a fresh address and the pool loses depth. The contract hasn't changed. The tier is now High.
Match the token to a tier first, then work backwards to see which signal produced it. The next sections do that for the likelihood side of the score, the exit side, and the evidence quality underneath both.
How Likelihood and Impact Combine into a Score
Every risk framework starts with the same two dimensions. The U.S. National Institute of Standards and Technology defines risk as a function of the likelihood that an adverse event occurs and the impact if it does, which means a low-probability event can still be serious when the consequences are extreme. A frequent problem with a limited cost can be far more manageable than a rare one that wipes out the position.
NIST's historical SP 800-30 method makes that concrete. High likelihood is scored 1.0, medium 0.5, low 0.1. Impact is scored 100, 50 or 10. Multiply the two and you get an exposure scale running from 1 to 100.
| Likelihood | Impact | Risk points (likelihood × impact) |
|---|---|---|
| High (1.0) | High (100) | 100 |
| High (1.0) | Medium (50) | 50 |
| Medium (0.5) | High (100) | 50 |
| Medium (0.5) | Medium (50) | 25 |
| High (1.0) | Low (10) | 10 |
| Low (0.1) | High (100) | 10 |
| Medium (0.5) | Low (10) | 5 |
| Low (0.1) | Medium (50) | 5 |
| Low (0.1) | Low (10) | 1 |
Severity is what pulls a long shot up the table. A rare event with extreme impact scores 10 points, an order of magnitude above a rare event with limited impact at 1 point, and level with a frequent but minor problem. That's the honest reading of the arithmetic: severity lifts a low-probability event into the same band as a routine nuisance rather than automatically above it. The top of the scale, 100 points, is reserved for the combination of a likely event and a severe one.
Mapping the two dimensions onto Solana signals
Likelihood on a meme coin comes from structure. How much supply sits in the top wallets, whether those wallets were funded from a common source, what the creator wallet has done on previous launches, and whether volume looks organic or manufactured. None of those readings is a probability in the statistical sense. They're evidence that shifts the odds up or down.
The matrix below shows how the two dimensions combine before any token-specific evidence enters the picture.
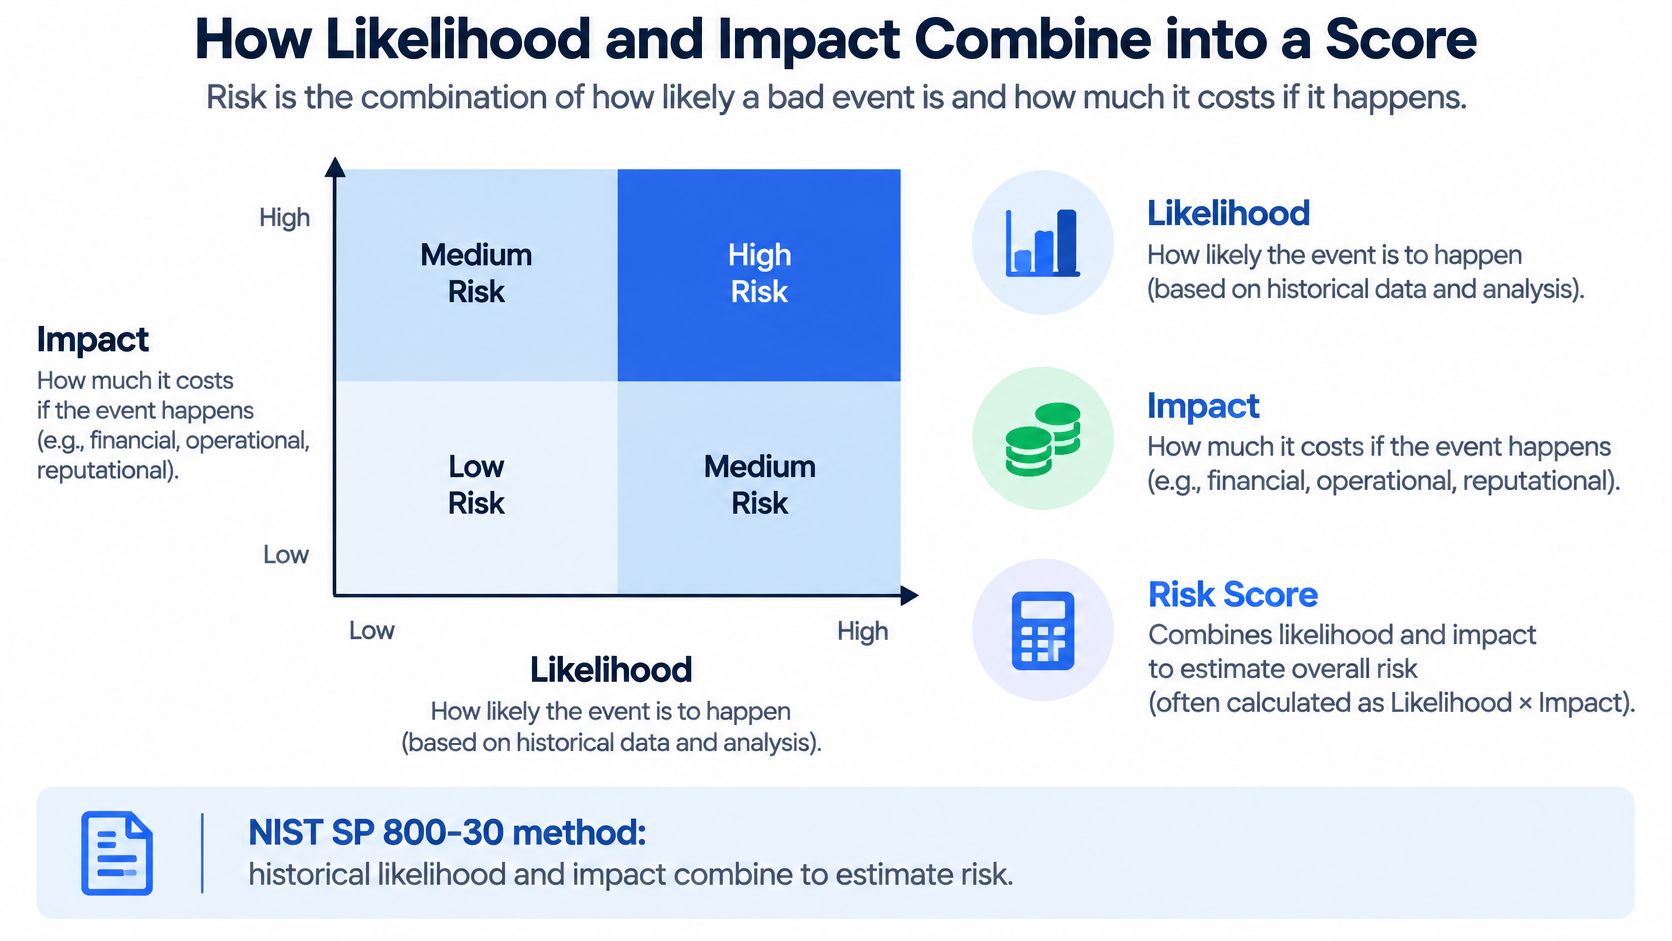
Impact is the dimension most buyers skip, and it's the one that decides how much money you recover. For a given token, your impact is set by position size against pool depth. The same token can be a small inconvenience to one buyer and a total loss to another, which is why no rating can be universal and why a score that ignores your size is telling you about the token rather than about your trade.
Scores rank tokens against each other. A heavy top-holder share pushes a token up the list, but on its own it says nothing about exit capacity, creator history or liquidity decay. Treat the number as a sorting tool, then go find the evidence that produced it.
Liquidity Checks That Show Whether You Can Exit
Displayed market capitalization tells you what the market thinks a token is worth. It says nothing about how much of your money survives the sell order. The SEC's investor alert on crypto asset securities identifies crypto markets as vulnerable to both illiquidity and high volatility, and warns that concentrated, opaque ownership increases exposure to loss.
The distance between those two numbers, what the chart says and what the pool holds, is the whole lesson.
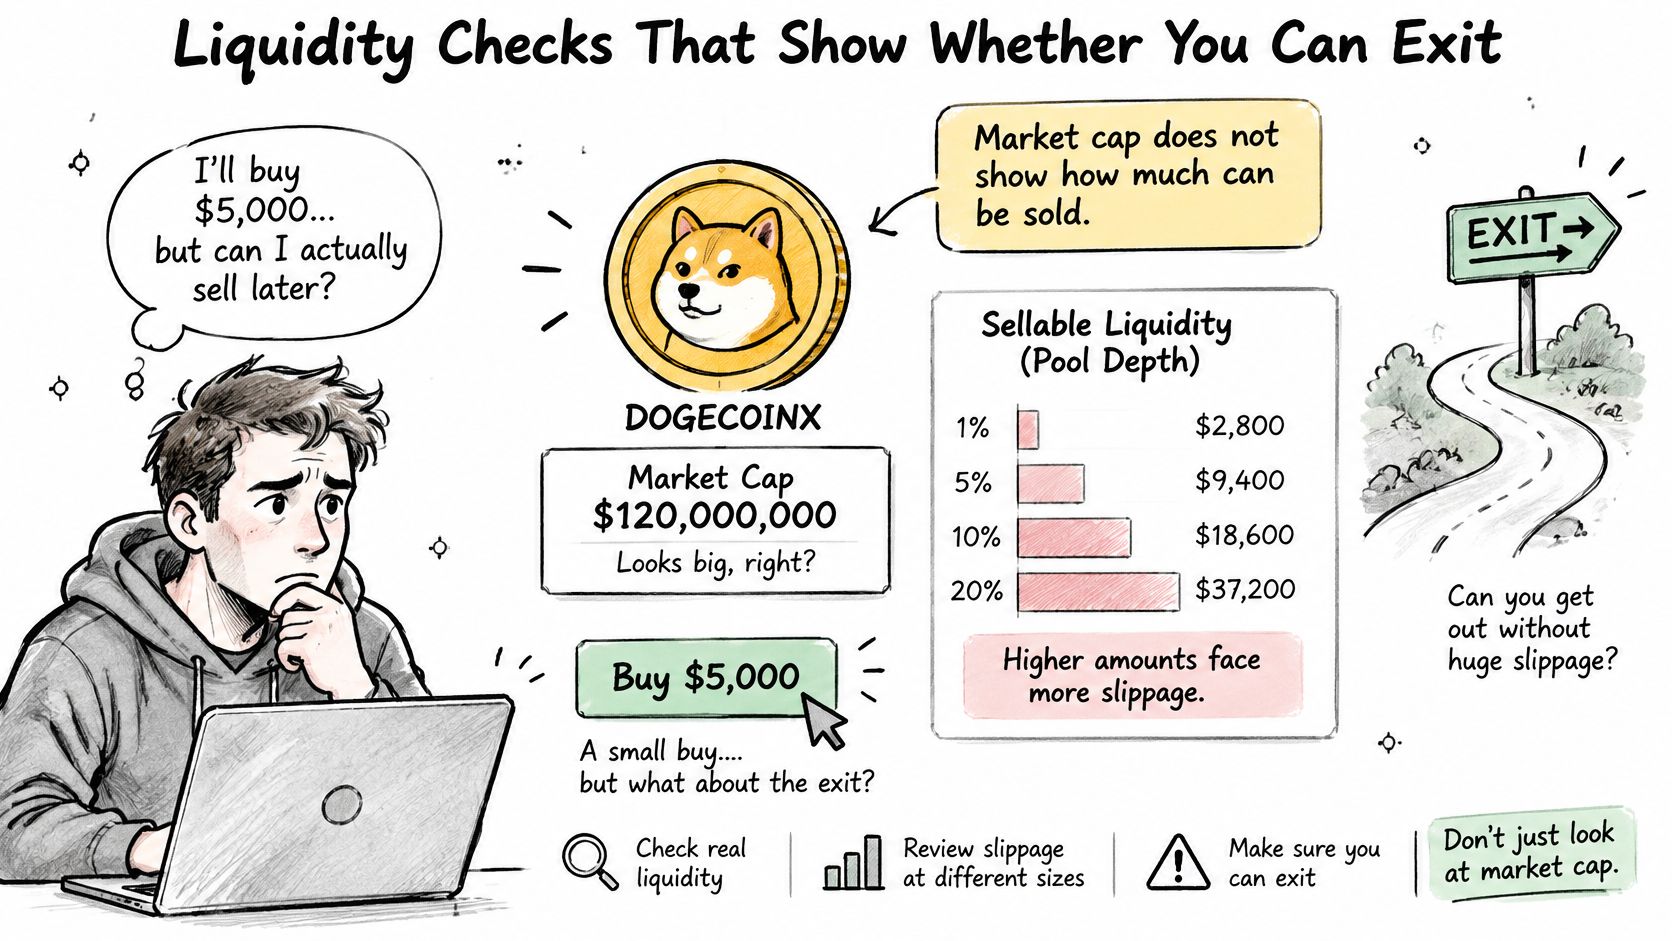
Say you plan a $5,000 buy. Against a pool holding $20,000 of liquidity, your order is a quarter of the pool and the price impact is punishing. The same $5,000 against $400,000 of liquidity barely registers. Same token, same chart, opposite exit. This is the difference between market-impact risk and outright exit-scam risk, and it's the reason displayed market cap is a vanity metric for anyone who plans to sell.
- Set the position size before anything else. Every liquidity reading is meaningless until it's measured against the amount you intend to put in.
- Walk the pool at several price levels. Mid-price depth flatters a shallow pool, so check how much liquidity sits a few percent away from the current price.
- Convert that depth into expected slippage. If a sell of your size returns materially less than the quoted price, that difference is the true cost of the trade.
- Stress-test a simultaneous top-holder exit. Add up the balances of the largest holders and ask whether the pool could absorb them selling at the same time.
- Compare liquidity now with liquidity at launch. A pool that has thinned since launch is telling you something a launch-day snapshot hides.
Liquidity locks are the most overrated item on that list. A lock can cover only part of the pool, expire sooner than the marketing suggests, or sit alongside other routes that insiders use to sell. Treat a lock as one input among several, never as a guarantee.
For a walkthrough of how pool depth turns into price impact, the video below covers the mechanics visually.
| Signal | Lower-risk reading | Higher-risk reading |
|---|---|---|
| Pool depth versus planned position | Pool holds many times the intended size | Pool is small relative to the largest holder balances |
| Slippage across price levels | Price impact stays small across several exit sizes | Small sells move price sharply |
| Liquidity change since launch | Stable or growing over the first hours | Abrupt withdrawal or a sharp fall |
| Liquidity lock | Lock covers most of the pool with a checkable expiry | Lock covers part of the pool, expires soon, or sits beside other insider sell routes |
| Top holders selling together | Pool absorbs a simultaneous sell from the top holders | Combined top-holder balances exceed pool capacity |
The actionable signal is the interaction of pool depth, holder concentration, recent liquidity changes and observed sell pressure. A single binary label can't carry that. The Solana liquidity checker keeps the raw pool measurements visible next to the tier, so you can see which of those four readings did the work. If the pool can't absorb your exit at a tolerable cost, size down or skip the trade entirely.
Holder Concentration and Coordinated Wallets
Manipulation risk rises when the demand you're measuring was produced by the same people who will sell to you. An SEC filing on crypto market risk warns that crypto assets face fraud and market-manipulation risks, including artificial price increases promoted through social media. Research on Solana rug pulls goes further: wash trading across multiple accounts can inflate volume, shrink the apparent share of tokens sitting in liquidity pools, and manufacture the fear of missing out.
That creates a measurement problem. Raw volume, wallet count and top-holder percentage can each look healthy while the ownership graph underneath them is synchronized. Coordinated holders can even produce the illusion of low concentration by spreading balances across many addresses.
The checks that catch it are structural, not cosmetic:
- Funding source: cluster addresses by the wallet that first funded them. Wallets fed from one source usually act as one participant.
- Transaction timing: near-identical entry and exit timestamps across addresses are a signature, not a coincidence.
- Shared counterparties: repeated trades against the same small set of addresses point to a closed group trading with itself.
- Repeat sequences: the same buy, sell, buy rhythm across a set of wallets signals distribution dressed as activity.
The escalation pattern worth the most attention combines several of those at once: high volume arriving soon after launch, first-day activity concentrated in a few wallets, rapid holder growth, and then liquidity falling away. That sequence is the one associated with Solana rug-pull behaviour, and it rarely announces itself as a single red flag.
Treat unusually smooth volume, wallets that move in step, and price acceleration that starts on social media rather than in the order book as evidence of distribution risk, not confirmation of demand.
Testing a specific token is best done by hand the first few times, because the pattern is easier to recognize than to describe. The Solana holder checker surfaces the wallet clusters and concentration readings side by side for that kind of review. Mint and freeze authority belong in the same pass: a token that keeps those powers can change the ownership picture after you've bought, which is why every full report checks minting and freezing authorities alongside liquidity, holder distribution, creator behaviour, wallet activity, trading patterns and historical risk indicators.
How Long a Risk Rating Stays Valid
A risk rating is a measurement with a timestamp, not a property the token carries around with it. On Solana the inputs decay fast. Early wallets sell into strength, liquidity gets pulled, bundled buyers distribute their allocations, and the artificial volume that made a chart look alive evaporates once the operators stop paying for it.
Some signals die within minutes. Others hold for days. Knowing which is which tells you whether you can act on yesterday's report.
Fast signals and slow signals
Fast signals track current state: pool depth, transfers by top holders, creator-wallet movements, volume that isn't matched by new holders, and the spread widening between buy and sell. These go stale quickly, and a report that doesn't show its observation time is hiding how old they are.
Persistent signals change slowly. Creator history, the record of a wallet cluster launching and abandoning previous tokens, and the reputation attached to a specific token address keep their meaning across days. A single old screenshot of a clean chart proves nothing about either category.
Practical rule: re-rate the token before every order, and never carry a rating across a liquidity event.
Recheck after any of these:
- Liquidity moves. A pool that gains or loses depth changes the exit math entirely.
- A top holder transfers. Large balances moving to fresh addresses reset the clustering picture.
- The creator wallet acts. Any transfer from the launch wallet is a reason to look again.
- Volume spikes without new holders. Activity without distribution is usually bots.
- The spread widens sharply. Thin books and widening spreads travel together.
The final piece is honesty about the evidence itself. Label each reading as direct (an observed transaction), inferred (a pattern consistent with coordination) or incomplete (a data source that failed or a token too new to cluster). A rating built on inferred and incomplete evidence can still be useful, but only if the reader knows which parts need verifying before money moves.
Misreadings That Make Low Risk Look Safe
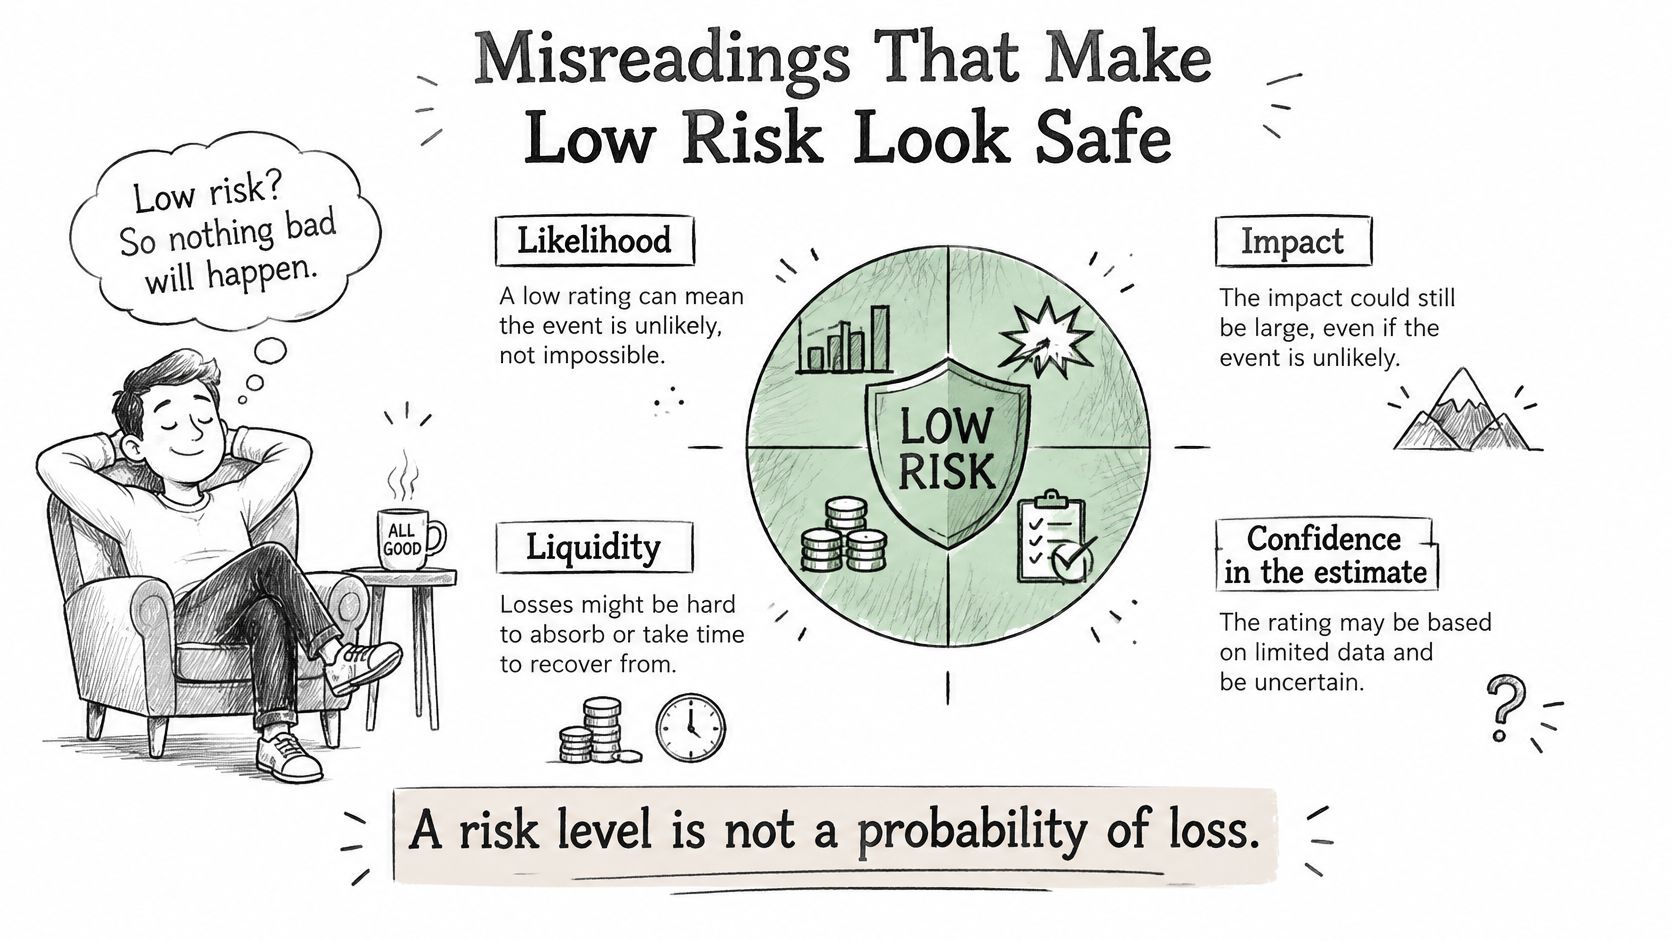
A low risk level is the most misread output in the entire toolkit. People read it as a probability that nothing will go wrong, when it's a statement that the specific signals checked were clean at the observation time.
Four dimensions get collapsed into that one word, and each of them matters on its own:
- Probability of a rug or malicious event. Structural evidence about control of supply and liquidity.
- Expected loss if it happens. What share of your position disappears.
- Ability to exit under stress. Whether the pool can absorb your sell when everyone sells.
- Uncertainty in the evidence. How much of the picture is inferred rather than observed.
A low rug-risk result says nothing about volatility, nothing about whether the price is fair, and nothing about protection from a market-wide crash. A token can be technically sellable and still be economically unsafe if the volume behind it is artificial or a few wallets can overwhelm the pool.
The 2008 crisis is the cleanest lesson in why confidence levels aren't guarantees. The Basel Committee on Banking Supervision defines value-at-risk as the expected worst loss over a specified horizon at a given confidence level. A one-day 99% VaR of $1 million means losses exceed $1 million on roughly one day in a hundred under the model. It doesn't mean a bigger loss can't happen. Regulators rewrote market-risk rules after the crisis because measured risk became misleading once liquidity disappeared, correlations shifted and historical data stopped representing conditions.
Launch-stage survival follows the same logic. Research examining 100,063 tokens issued on Solana venues during the first half of 2025 identified 76,469 as rug-pull tokens, so a token that clears its first hour hasn't thereby been proven safe. A study of Pump.fun activity that analyzed 6,000 Solana meme coins separated concealed accumulation, wash trading and fabricated social sentiment, and noted that fewer than 2% of tokens in one review of Q4 2024 Pump.fun activity successfully transitioned to major decentralized exchanges. Survival is a different risk from liquidity persistence.
Our own position is that a lower rug pull risk rating doesn't mean a token is safe, and a higher health score doesn't mean its price will rise. The numbers back that caution: tokens flagged high rug risk had an average price change of −45.3% over 24 hours, based on 1,320 tokens analysed from 2026-08-03 to 2026-10-22. A high tier means the evidence points to danger. A low tier means only that the checked signals were clean when the check ran.
Check the Risk Tier Before Your Next Buy
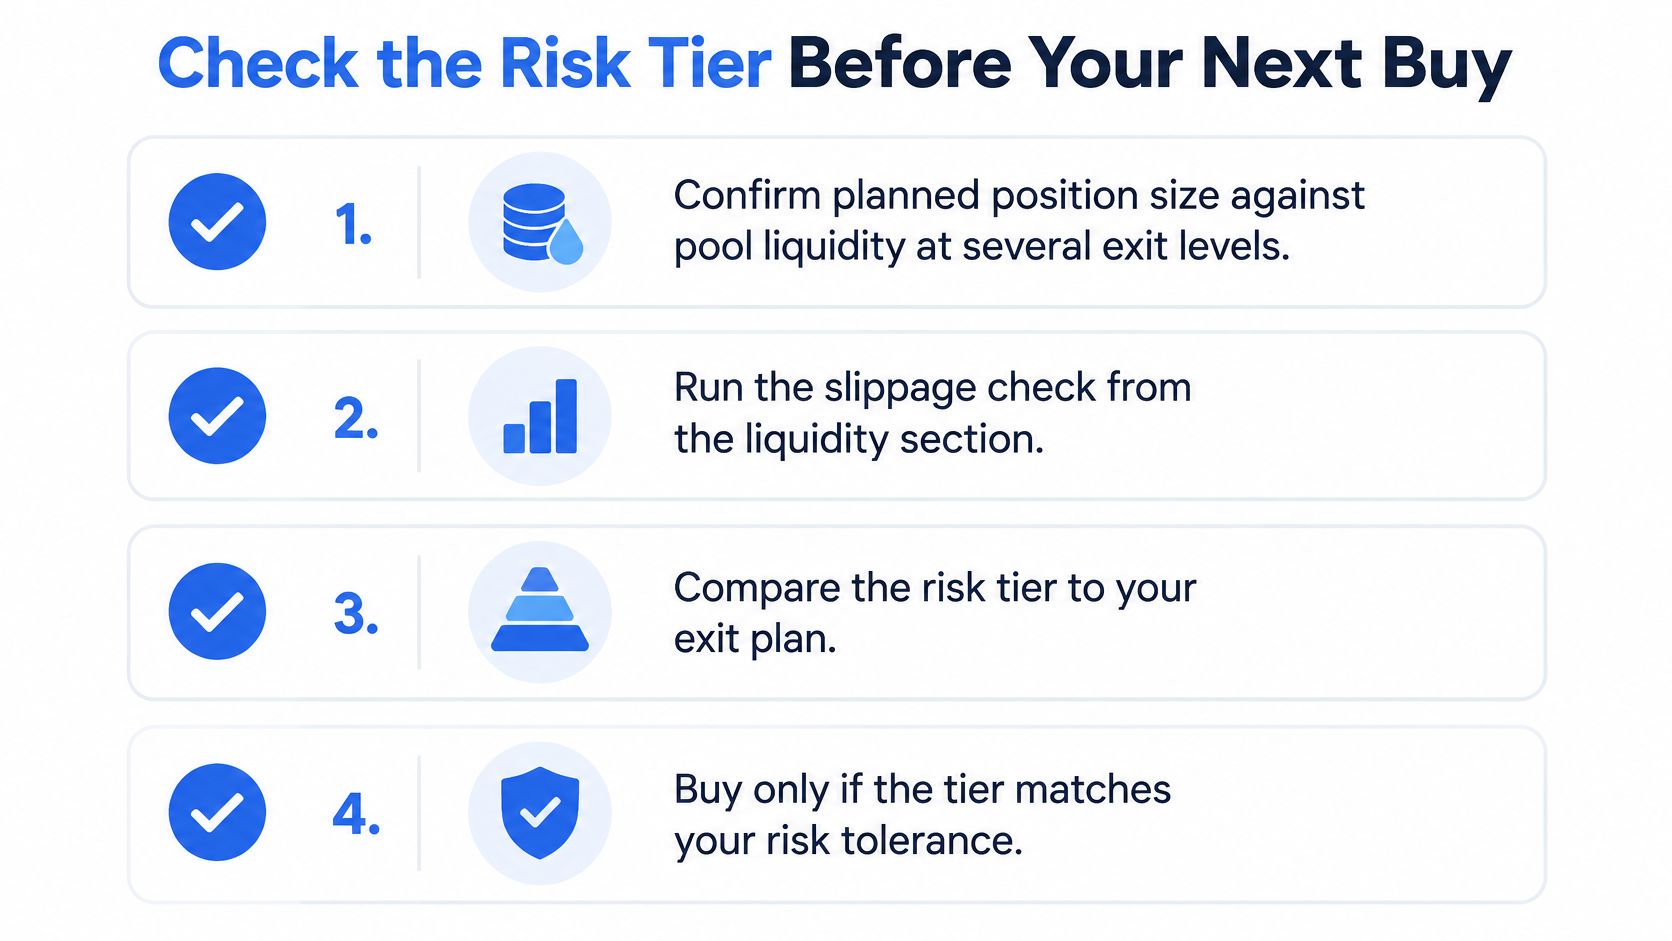
The checks only help if they happen before the order, not after it. Run this routine every time, and keep it short enough that you'll do it:
- Size against the pool. Confirm your planned position against liquidity at several exit levels, using the slippage check from the liquidity section.
- Scan the holders. Look for synchronized wallets, common funding sources and bursts of near-identical trades.
- Review what changed since launch. Liquidity additions or removals, plus any recent transfers by top holders.
- Match the token to a tier. Skip Critical entirely, avoid High unless the evidence improves, and cut your size on Moderate.
- Stamp the time and set recheck triggers. Note when the readings were taken and what event would force a fresh look.
Every full analysis on this site produces four outputs: an Overall Health Score, a Rug Risk Rating, a plain-English AI Verdict and a Detailed Risk Breakdown, so the evidence behind the tier stays attached to it. If you want the broader process first, the guide to buying Solana meme coins safely walks through it end to end.
The decision rule is simple. A token moves from watch to buy only when its tier, its liquidity and its holder evidence all point the same way. One green reading never outvotes two red ones.
MemeAssist grades a token on the dimensions this guide describes: likelihood signals from holder and creator structure, impact signals from liquidity and exit capacity, and a plain-English verdict explaining which evidence drove the rating. Each report keeps the underlying checks visible so you can dispute the conclusion rather than take it on faith, and flagged tokens are tracked for 24 hours so the ratings get calibrated against what happened. Run a token address through MemeAssist before your next buy and see which signals are carrying the score.
Topics: levels of risk, Solana meme coin risk, meme coin safety, rug pull signals, token risk rating
Informational only, not financial advice. Meme coins are extremely high-risk.
All articles