Liquidity Analysis Example: How to Read Token Slippage
You've been in the token for three days. The pool shows six figures of liquidity, the chart is calm, and you've already worked out the profit at the current price. Then you sell half your bag and the USDC that lands in your wallet is a few percent light. Nobody charged you a fee that big. The pool repriced as you sold into it.
That shortfall is slippage, and it's the one cost of a trade you can calculate before you commit. It isn't a mystery, a scam, or bad timing. It's arithmetic that depends on two things you already know: the size of your order and the reserves sitting in the pool.
Most explanations of a liquidity analysis example stop at the pool balance, as if depth on a dashboard were the same thing as a fair exit. It isn't. The same pool can charge you half a percent on one sale and nine percent on another, in the same minute, with nothing else changing. What follows is the arithmetic behind that difference, worked through a typical pool with real numbers, so you can run it on your own position.
Table of Contents
- A Worked Liquidity Analysis Example at a Glance
- Four Liquidity Measures That Decide Your Fill
- How to Calculate Slippage Step by Step
- Reading Liquidity Results Before You Trade
- Where Liquidity Analysis Stops Protecting You
- Confirm Your Exit Size Before You Buy
A Worked Liquidity Analysis Example at a Glance
Say you hold 500,000 tokens of a Solana meme coin and the only liquid venue is a constant-product pool holding 100,000 USDC and 1,000,000 tokens. Divide the USDC reserve by the token reserve and you get a spot price of 0.10 USDC per token. Your bag is nominally worth 50,000 USDC.
That number is a quote for one token, not for 500,000 of them. A pool doesn't have a price. It has a curve, and every sale slides you further along it. Solana is where most of this trading now happens: the OKX State of DEXs 2025 report found that Solana-based decentralized exchanges represented 48% of total DEX trading volume in 2025, so this pool shape is the one most meme-coin traders encounter.
One pool, four sale sizes
Run four order sizes through the curve and the spread of outcomes tells the whole story.
| Sell size (tokens) | Share of token reserve | USDC received | Ideal USDC at 0.10 | Slippage | Spot price after sale |
|---|---|---|---|---|---|
| 5,000 | 0.5% | 497.51 | 500.00 | 0.50% | 0.0990 |
| 10,000 | 1% | 990.10 | 1,000.00 | 0.99% | 0.0980 |
| 20,000 | 2% | 1,960.78 | 2,000.00 | 1.96% | 0.0961 |
| 100,000 | 10% | 9,090.91 | 10,000.00 | 9.09% | 0.0826 |
Outcomes for four sell sizes in a pool of 100,000 USDC and 1,000,000 tokens at a 0.10 spot price, with pool fees excluded.
Two assumptions keep the arithmetic visible. The pool follows x·y = k, the standard constant-product curve, and pool fees are excluded so you can see the price-impact cost on its own. On a live Solana pool you'd add the trading fee on top, which makes every row slightly worse.
Read the edges of the table. A sale of 5,000 tokens, just 0.5% of the token reserve, costs 0.50%. A sale of 100,000 tokens, 10% of the reserve, returns 9,090.91 USDC instead of 10,000, a loss of 9.09%, and leaves the spot price at 0.0826, roughly 17% below where it started. Same pool, same minute, twenty times the cost.
Every liquidity analysis example starts with one question. Not how much liquidity exists, but how much you intend to sell.
That's why a dashboard reading "100,000 USDC of liquidity" tells you almost nothing about your exit. It's a reserve balance, and your cost is a function of the ratio between your order and that balance.
Four Liquidity Measures That Decide Your Fill
Merging onto a busy motorway has three costs that land at the same moment. The spread is the toll at the entrance. Depth is the width of the lane you join. Price impact is how much the traffic slows as your vehicle grows from a motorbike into a truck. Each cost is measured differently, and each one changes what your order receives.
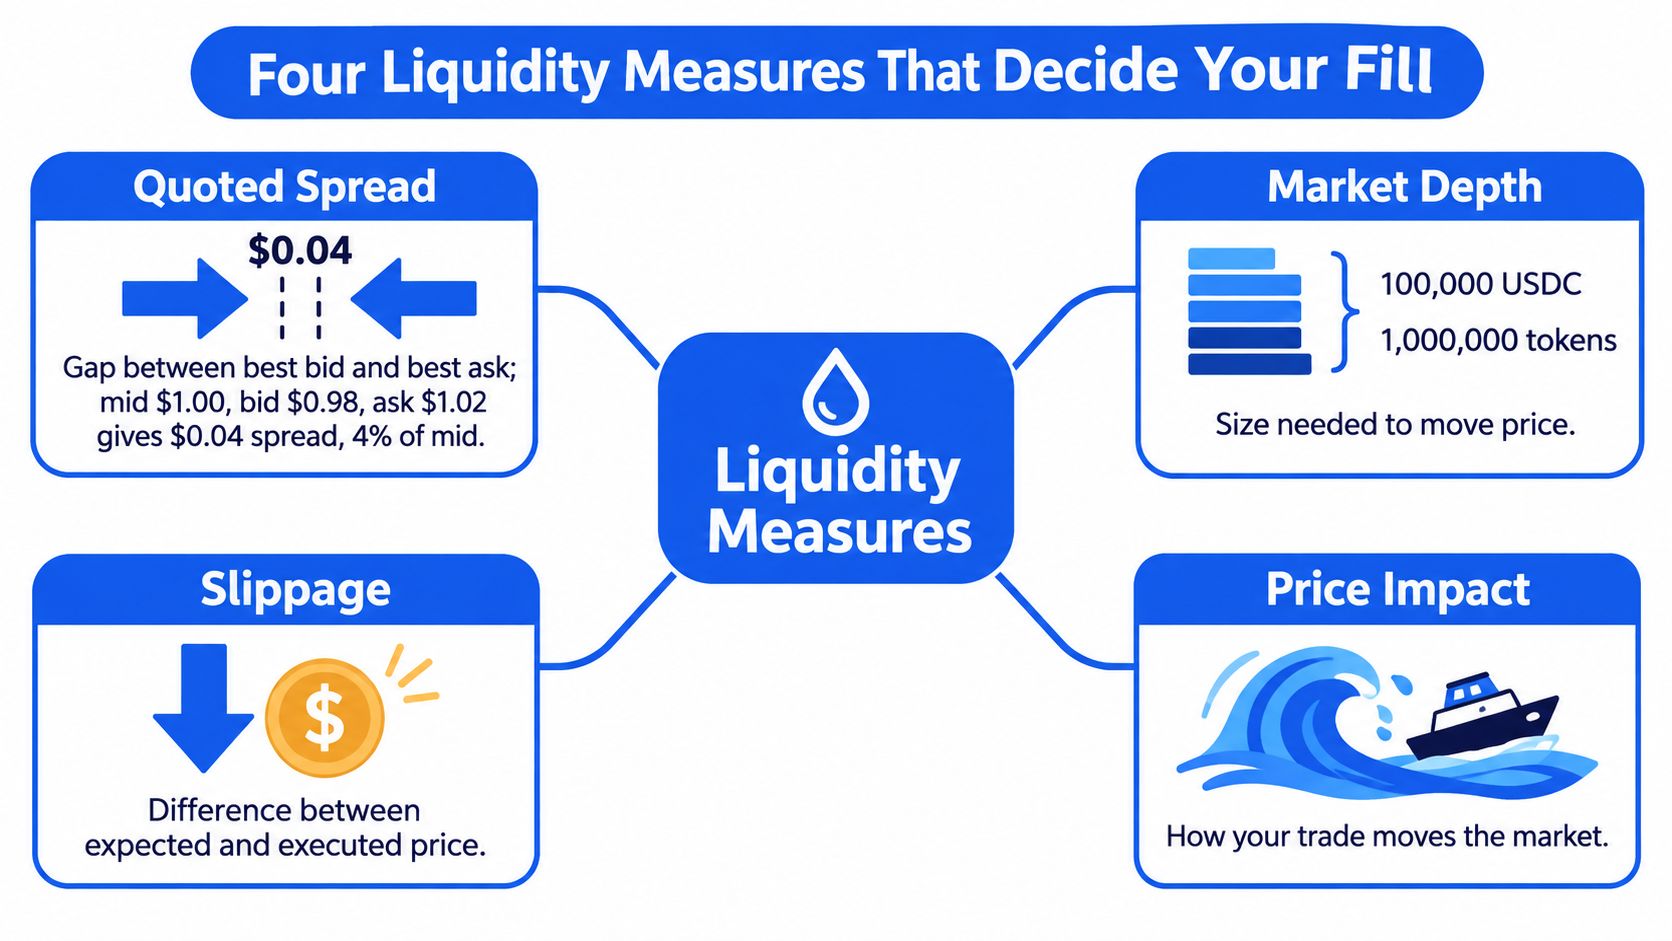
Take a token quoted at a mid-price of $1.00 with a best bid of $0.98 and a best ask of $1.02. The quoted spread is $0.04, or 4% of the mid-price. That figure is the round-trip transaction cost of buying at the ask and selling at the bid, before any fee. The toll is the same whether you buy $200 or $200,000, because it sits in the quote itself.
What each measure actually charges you
Depth answers a different question: how much can trade near that quote? In the same market, only $10,000 is available within 1% of the mid-price, so a $50,000 market order has to work through progressively worse prices to fill. Depth decides whether your size fits at all.
Slippage is the bill for the gap you paid: ideal output minus received output, divided by ideal output. Price impact measures how much your own flow moves the price. An Amihud-style ratio captures it as absolute return divided by dollar trading volume, and a higher reading means thinner liquidity. These four measures are complementary, not interchangeable. The spread captures the round-trip transaction cost. Depth captures how much trades near the quote. Slippage captures the gap between expected and received output. Price impact captures how sensitive price is to order flow.
| Measure | What it captures | Formula | Example value |
|---|---|---|---|
| Quoted spread | Transaction cost of a round trip | (Ask minus bid) divided by mid-price | $0.04 on a $1.00 mid, or 4% before fees |
| Market depth | Quantity that trades near the quoted price | Size available within 1% of mid-price | $10,000 within 1% of mid |
| Slippage | Gap between expected and received output | (Ideal output minus received) divided by ideal | 9.09% at 10% of the token reserve |
| Price impact | Sensitivity of price to order flow | Absolute return divided by dollar volume | Higher ratio means thinner liquidity |
Keep that table as a reference card. A pool can look fine on one line and fail you on another. A tight spread with thin depth means small orders fill cleanly and large exits do not. A wide spread over deep reserves is worse for tiny trades and better for big ones, because the cost is fixed and predictable instead of rising with size. The same reserve can look comfortable on a dashboard and still cost about 9% once your sale is a large share of it. If you want a practical benchmark for how much liquidity a Solana meme coin needs before you will touch it, our guide to minimum liquidity for a Solana memecoin lays out the thresholds.
One habit matters more than any single reading. Compare these measures across normal and stressed windows, not just the quiet afternoon when you are doing research. Depth at noon was supplied by people who will also want to leave when the selling starts, and that is exactly when the lane narrows.
How to Calculate Slippage Step by Step
The whole calculation takes about ninety seconds on a phone calculator. Here it is for a 10,000-token sale into the pool from the first section.
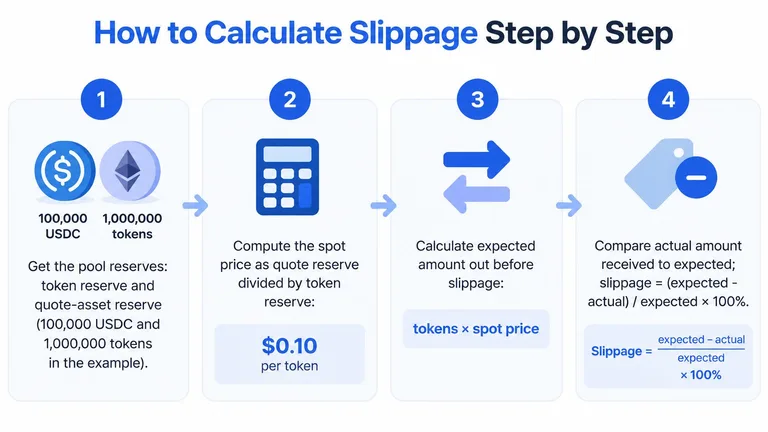
- Pull the reserves. Read the token reserve (1,000,000) and the quote-asset reserve (100,000 USDC). Everything downstream depends on these being current, so refresh right before you calculate. A stale snapshot produces a confident wrong answer.
- Get the spot price. Quote reserve divided by token reserve: 100,000 ÷ 1,000,000 = 0.10 USDC per token. This is the price of one token, not the price of your order.
- Compute the ideal output. Sell amount times spot price. For 10,000 tokens: 10,000 × 0.10 = 1,000 USDC. That's the number a naive dashboard implies you'll receive.
- Compute the constant-product output. New token reserve = 1,000,000 + 10,000 = 1,010,000. The invariant k = 100,000 × 1,000,000 = 100,000,000,000. New quote reserve = k ÷ 1,010,000 = 99,009.90 USDC. Your output is 100,000 − 99,009.90 = 990.10 USDC. This is the step where the price moves, and it's the only one that decides what you get.
- Divide the difference. (1,000 − 990.10) ÷ 1,000 = 0.99%. That's your slippage at this size, before fees and before priority costs.
- Check the price you leave behind. After the sale the spot price is 99,009.90 ÷ 1,010,000 = 0.0980. Skipping this hides the cost of your next sale, because your second clip starts from a lower price than the first one did.
When the real world adds cost
Notice how much of the total is decided by the ratio in step 4, not by the quote in step 2. A trade that looks like it's executing at 0.10 is really executing at an average somewhere below it, and a research paper hosted by NYU Stern on liquidity and price impact puts a real case on that gap: an S&P Global example in which a trade received 90.66 tokens instead of an expected 100, a 9.34% shortfall.
That paper also draws a distinction worth internalising. Displayed liquidity is what the pool shows. Executable liquidity is what's practically available at prices near the quote, and concentrated or uneven positions can make that range far narrower than the balance suggests.
Run steps 1 through 5 at 0.5%, 2% and 10% of your pool's token reserve before you buy anything. The three numbers tell you what your exit costs at three different sizes, and that's the whole analysis.
Reading Liquidity Results Before You Trade
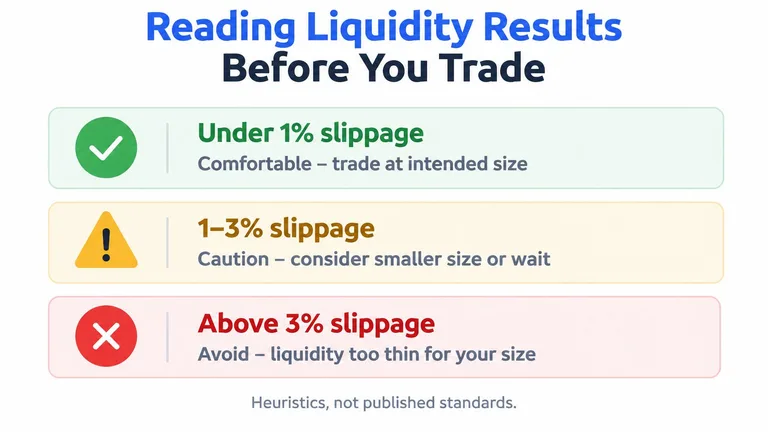
The arithmetic gives you a percentage. Turning that percentage into a decision needs a rule of thumb, and the bands below are working heuristics rather than published standards.
Three bands to start with
- Under 1% at your intended size. Comfortable. Trade the size you planned and stop thinking about execution.
- 1% to 3%. Workable, but only with a plan. Consider limit orders, a slightly smaller clip, or waiting for volume to refill the pool.
- Above 3%, and especially above 5%. Treat it as a warning. Size down, find a different venue, or skip the exit you were about to make.
The 20,000-token case
A trader selling 20,000 tokens from the example pool receives 1,960.78 USDC instead of 2,000, a 1.96% slippage, and pushes the spot price from 0.10 to about 0.0961, roughly 4% lower. That lands in the caution band, so splitting the exit looks sensible.
Only sometimes. Splitting saves money when liquidity returns between clips or when the clips route to different venues. In a constant-product pool with no fees and no refill, two sales of 10,000 tokens return the same 1,960.78 USDC as one sale of 20,000, because the price path doesn't change the total.
Practical rule: check whether the pool refills between clips before counting on a saving. If it doesn't, splitting just gives you two chances to be slow.
Where Liquidity Analysis Stops Protecting You
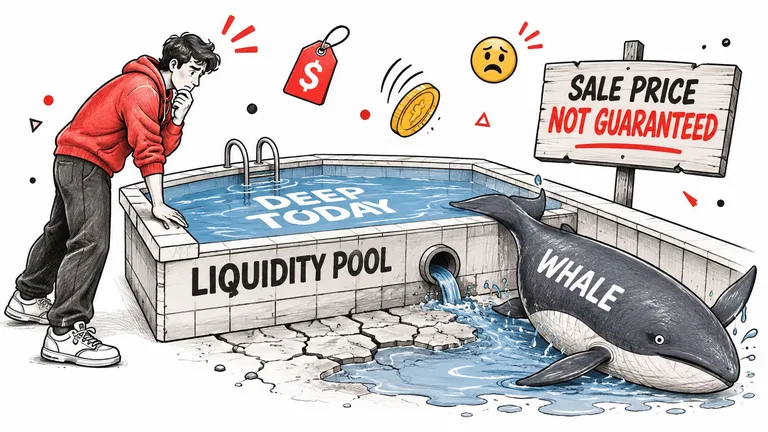
A pool can be deep, tight and cheap to exit at 9am and hand you a terrible price at 9pm. A slippage figure is a snapshot, not a promise, and the balance that produced it can change before your sell lands.
What the pool balance can't see
Token risk usually sits outside the reserves entirely. A creator wallet holding a large share of supply can sell into the same curve you're relying on. A freeze authority can block your transfer so no amount of depth helps. A burst of volume can look like health until the sellers stop and the bids vanish with them. High trading volume is not proof of exit capacity, because volume and depth are different measurements of different things.
That's why our analysis checks mint and freeze authorities alongside liquidity, holder distribution, creator behaviour, wallet activity, trading patterns and historical risk indicators. A mint authority alone can dilute a pool faster than any single seller. Tokens we flagged high rug risk had an average 24-hour price change of −45.3%, based on 1,320 tokens analysed between 2026-08-03 and 2026-10-22, and in most of those cases the pool balance was never the problem.
If you're trading pre-graduation tokens, the curve itself changes the math, and our breakdown of Pump.fun bonding curve trading risks covers what your exit looks like before real liquidity exists.
So here's the honest split. Liquidity analysis gives you the execution cost at a given size, the depth near the quote, and the slippage across order sizes. It cannot tell you what holders intend to do, whether liquidity will be pulled tomorrow, or what news arrives tonight. Use it as one input, not a verdict.
Confirm Your Exit Size Before You Buy
Run this sequence before you enter, not after. Entry is easy to reverse in your head. Exit is the part that costs money.
- Set the exit size you'd realistically sell. Half your bag, a third, the whole thing. Not the size you hope to sell at the top.
- Run the slippage calc at 0.5%, 2% and 10% of the pool's token reserve. Note the spot price after each sale, because that's the price your remaining bag inherits.
- Compare depth within 1% of mid against your exit size. If your order exceeds that depth, assume the price moves against you and the quote you saw won't hold.
- Price the full round trip. Add the entry cost to the exit cost. A 4% spread paid twice is 8% of performance you have to recover before you're even.
- Re-run everything after a large move. Reserves shift, fees accumulate, and yesterday's table is stale the moment the price gaps.
- Decide. Size down if the cost is above your band. Split with limit orders only if the pool plausibly refills between clips. Skip the trade if the exit cost eats the thesis.
If you'd rather automate the check than run it by hand, a live exit-liquidity check costs $0.05 and a full token analysis with a conditional Trade Setup costs $0.20, both optional on top of free tools that include the Liquidity Checker, Solana Token Analyzer and Contract Checker. You can run the Solana exit liquidity checker on a live token before you size a position. Either way, understand what you're buying. These checks reduce risk. None of them removes it.
Every trade you place on Solana has an exit cost, and it's cheaper to know that number before you buy than to discover it while you're selling. MemeAssist runs the checks behind this article on live on-chain and market data, covering liquidity depth, holder distribution, creator behaviour and mint or freeze authorities, then explains what the evidence means in plain language. Run a free analysis on MemeAssist on the next token you're considering, and let the exit liquidity be a number you chose rather than one you found out about too late.
Topics: liquidity analysis example, token slippage, price impact, DEX liquidity, Solana token risk
Informational only, not financial advice. Meme coins are extremely high-risk.
All articles