Liquidity Pool Crypto Explained: How Pools Work on Solana
Learn how liquidity pool crypto works on Solana, which metrics show pool safety, and how to spot rug pulls before you trade or exit.
Published
Updated
You've found a Solana token that's moving fast, the chart looks strong, and the pool page shows what seems like plenty of liquidity. So you buy. Ten minutes later you try to sell, and the quote is far below the price on screen, or the trade won't go through at any price you'd accept. That gap between buying easily and exiting cleanly is where most losses happen. Understanding liquidity pool crypto mechanics means judging a pool by one question above all others, which is how cheaply and reliably you can get out.
Table of Contents
- What a Liquidity Pool Is and How Trades Use It
- Pool Safety Metrics to Check Before You Trade
- How Trade Size Moves Price and Why Exits Get Expensive
- Earning Fees as a Liquidity Provider Without Losing to Impermanent Loss
- How Routers Choose Pools and Where Trades Go Wrong
- Rug Pulls, Soft Rugs and Wash Trading Signals
- Confirm Your Exit Route Before You Buy
What a Liquidity Pool Is and How Trades Use It
Think of a liquidity pool as a shared cash drawer with two compartments. One side holds a token, the other holds a quote asset such as SOL or USDC, and both sit locked in a smart contract vault. You never meet a seller. When you swap, you put one asset into the drawer and take the other out, and the contract sets the exchange rate.
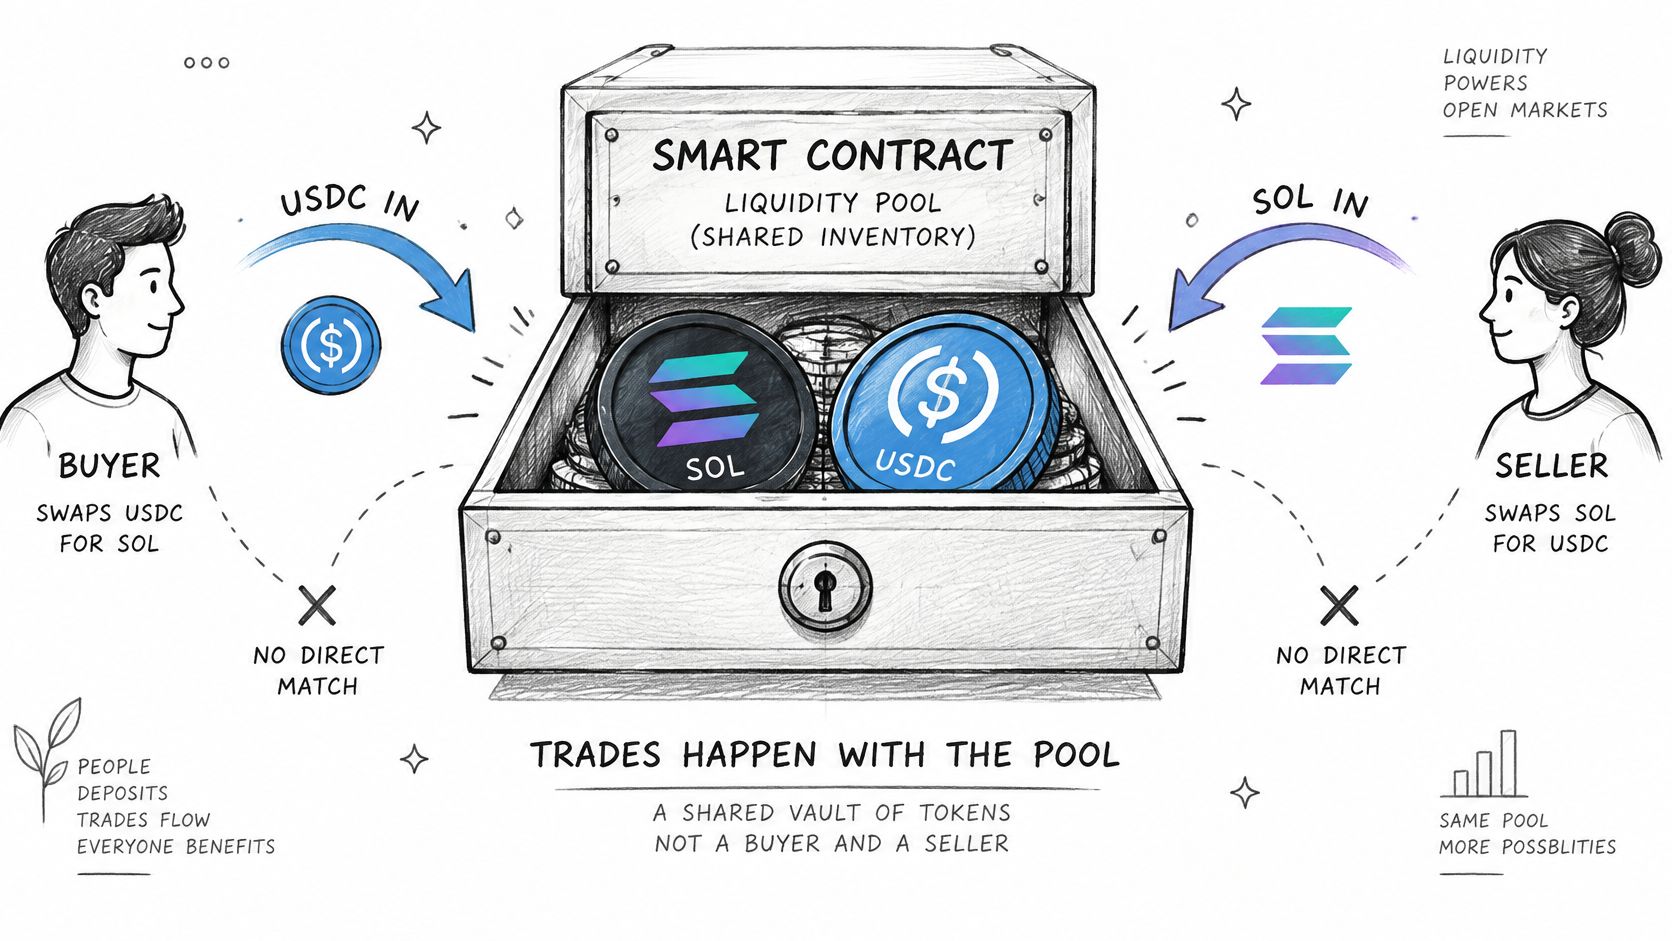
How the Price Gets Set
An automated market maker, or AMM, prices each trade from the ratio between the two reserves. Most simple pools follow the constant product rule, where the token reserve multiplied by the quote reserve stays roughly fixed. If one side shrinks, each remaining unit becomes more expensive, which keeps the product balanced after every swap.
Say a pool holds 1,000,000 tokens and 50 SOL, purely as a worked example. That ratio prices the token at 0.00005 SOL. When a buyer pays SOL in and removes tokens, fewer tokens remain against more SOL, so the next buyer pays a higher price. A seller does the reverse, adding tokens and removing SOL, which pushes the price down. There's no negotiation and no order book, just the ratio recalculating after each trade.
Who Fills the Drawer
Liquidity providers, or LPs, deposit both sides of the pair and receive LP tokens as a receipt. That receipt represents their share of the reserves, and they can redeem it later to withdraw their portion, plus any fees earned. Whoever holds the LP tokens controls that withdrawal right, which is why their location matters so much later.
On Solana, fast and cheap transactions let anyone create a pool in seconds on venues like Raydium, Orca and Meteora. That ease is useful, but it also means thousands of thin, short lived pools exist alongside deep ones. For scale, in Q4 2025, Raydium's average total value locked was $1.10 billion, down 26.11% from the prior quarter and 30.38% year over year, according to figures Token Terminal published. A large platform total tells you nothing about the one pool you're about to trade against.
What to open first: Every pool page shows the pair, both reserves, the LP token holders and the creation date. Those four fields are your starting point before any other metric.
Pool Safety Metrics to Check Before You Trade
You can run a useful first pass in about five minutes. Work through each row below, note what you find, and treat the results as a set rather than hunting for one reassuring green tick.
| Metric | What it tells you | Where to check | Red flag |
|---|---|---|---|
| Pool liquidity (USD) | How much value sits in the pool | Pool page on Raydium, Orca or Meteora | Liquidity small relative to market cap |
| Liquidity to market cap ratio | Whether depth is proportionate to the valuation | Pool data divided by token market cap | Ratio falling as price rises |
| LP lock or burn status | Whether the provider can withdraw liquidity | LP token lock or burn explorer | LP tokens unlocked or lock expiring within days |
| LP token concentration | Whether one wallet controls the removable side | Top LP holders list | One wallet holding most LP tokens |
| Token supply concentration | Whether a few wallets can sell into the pool | Top holders list | Top ten wallets holding a large share of supply |
| Mint authority | Whether new tokens can be created | Token metadata | Mint authority still active |
| Freeze authority | Whether accounts can be frozen | Token metadata | Freeze authority still active |
| Pool count and age | Whether volume is spread across pools or sits in a new one | Token pair listings | Newest pool carrying most of the volume |
The Two Rows That Decide Your Exit
Start with liquidity relative to market cap. A pool holding a large dollar amount can still be shallow if the token's total valuation dwarfs it, because even modest selling then moves the price sharply. Divide pool liquidity by market cap and watch the direction. If price climbs while that ratio falls, the market is getting more fragile, not stronger, however exciting the chart looks.
Next, check LP lock or burn status. Burned LP tokens are gone for good, so nobody can use them to pull reserves. Locked tokens sit in a time lock contract until a stated date. Tokens sitting in a creator wallet are neither, and that wallet can withdraw the underlying liquidity whenever it likes. A lock expiring within days deserves the same caution as no lock at all, since your holding period may outlast it.
Reading the Rest as a Combination
LP token concentration tells you whether the withdrawal right sits with one party or many. Supply concentration answers a different question, which is whether a handful of holders own enough tokens to overwhelm the pool by selling. An active mint authority means new supply can appear and dilute you, and an active freeze authority means specific accounts can be blocked from transferring, which can include yours.
No single row proves a token is safe or dangerous. The combination that most often traps buyers is shallow liquidity relative to market cap, available LP tokens in one wallet, and supply concentrated among a few holders. Running these checks together is exactly what a Solana liquidity checker is built to consolidate, though reading the raw fields yourself teaches you what the summary means.
A lock stops LP withdrawal. It doesn't stop insiders from selling tokens they already hold into the pool, draining the SOL side through ordinary trades.
So treat locked or burned liquidity as one removed risk, never as a verdict. Ownership, authorities and depth still decide whether you can leave.
How Trade Size Moves Price and Why Exits Get Expensive
Slippage is the price you pay for size. Every sale adds tokens to the pool and removes quote asset, so the price falls while your own trade executes. You don't receive the price displayed before you clicked. You receive an average across a falling curve, and the bigger your sale relative to the reserve, the worse that average gets.
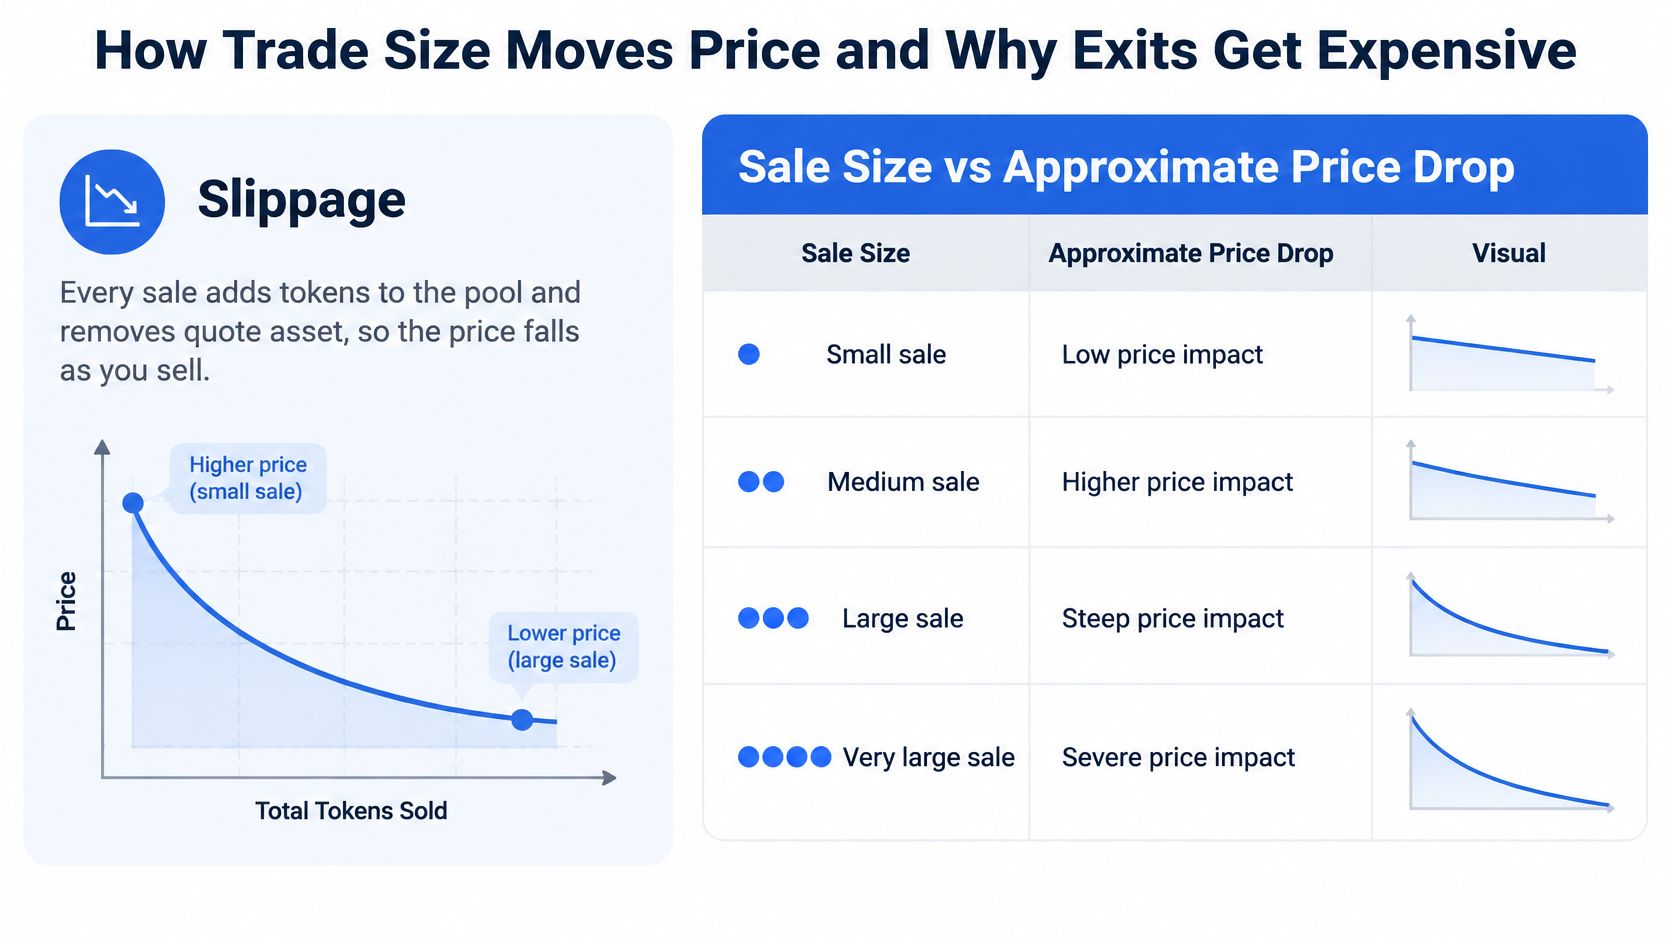
| Sale size (% of token reserve) | Approx. price drop | What it means |
|---|---|---|
| 1% | about 2% | Small exit, usually tolerable |
| 5% | about 9% | Noticeable loss on a planned exit |
| 10% | about 17% | Heavy loss, check if depth is enough |
These figures describe a constant product pool before fees, in a worked scenario. Notice the pattern. The price drop is roughly double the share of the reserve you sell, because your trade moves both sides of the drawer at once. Selling tokens equal to 1% of the reserve costs about 2%. Selling 10% costs about 17%, and that's if you're the only person selling at that moment.
Why the Headline Liquidity Number Misleads
The 10% row exposes the core confusion. A pool can display substantial nominal liquidity and still punish a realistic exit, because what matters is your sale compared with the reserve, not the reserve's absolute size. If several holders sell together, their combined sales stack onto the same curve, and later sellers receive far less than earlier ones.
Separate two ideas that pool pages blur together. Removable liquidity is what whoever holds the LP tokens could withdraw. Executable depth is what you could sell into at a price you'd accept. A pool can score well on the first and badly on the second. Liquidity is not the same as exitability, and exitability also depends on liquidity relative to market capitalization, the share controlled by the largest wallets, recent trade size, and whether liquidity can be withdrawn.
The stakes are documented on Solana. Research covering roughly 388,000 Raydium pools found that about 93% showed characteristics of "soft rug pulls," where liquidity was abruptly withdrawn, with a reported median loss of approximately $2,832 and the largest identified case reaching $1.9 million, according to the Solidus Labs report on Solana rug pulls and pump and dumps. That doesn't mean every pool you meet will behave that way. It means abrupt withdrawal is common enough that checking who can withdraw isn't paranoia, it's routine.
A Quick Test Before You Enter
Divide your planned exit size, in tokens, by the pool's token reserve. Find the matching row in the table and convert that price drop into dollars. Then ask a harder question: what happens if two or three larger holders exit just before you, shrinking the quote side first? If the resulting loss exceeds what you'd tolerate, the pool is too shallow for your position size, regardless of how large its liquidity figure looks on the page.
Earning Fees as a Liquidity Provider Without Losing to Impermanent Loss
Providing liquidity sounds like the safe side of the trade. You deposit both assets, traders swap against your position, and you collect a share of the swap fees. Since fees scale with volume, a busy pool looks like an income stream. That picture is incomplete, and the missing half is where LPs lose money while believing they're earning it.
What Impermanent Loss Actually Is
As the price moves, the pool rebalances itself automatically. Traders buy whichever asset is rising and sell whichever is falling, so your position gradually ends up holding more of the token that fell and less of the one that rose. Compared with holding both tokens in your wallet, you're behind. That gap is impermanent loss.
| Price change | What it means |
|---|---|
| 2x (or halved) | About 5.7% behind holding, a common loss on a big move |
| 3x | About 13.4% behind holding, so fees must be substantial |
| 5x | About 25.5% behind holding, and the LP is often worse off than holding |
The word impermanent misleads people. The loss only reverses if the price returns to where you deposited. The moment you withdraw at a different price, the gap becomes permanent and sits in your wallet. On a volatile meme coin pair, a 2x or 3x move in either direction isn't an edge case, it's a normal week.
Why High Volume Can Be a Warning
Here's the assumption worth challenging. High volume doesn't necessarily mean genuine demand, and fee income doesn't automatically outrun the loss above. Arbitrageurs rebalance the pool whenever its price drifts from other venues, and they capture the difference while LPs absorb it. Bots generate further volume that no ordinary buyer created. Extreme volatility widens those arbitrage gaps, discourages liquidity provision, and can even contribute to liquidity freezing during stressed markets.
Wash trading adds a more deliberate distortion. A 2025 academic analysis of Solana market manipulation concluded that wash trading exists on the chain, appears more prevalent among smaller tokens, and that trade timing behavior is a promising way to identify it, while also reporting a relationship between the number of liquidity providers and the percentage of wash trading, in the 2025 Technical University of Munich thesis on Solana wash trading. So an impressive volume to liquidity ratio can deserve more scrutiny, not less, especially when trades look repetitive or highly synchronized.
The decision test: Fees you realistically expect over your holding period must exceed impermanent loss plus the slippage you'll pay leaving the position. If they don't, holding the tokens outright is the better trade.
Before depositing, ask who generated the volume. Organic buyers paying fees are income. Synchronized wallets and arbitrage flow are costs wearing an income costume.
How Routers Choose Pools and Where Trades Go Wrong
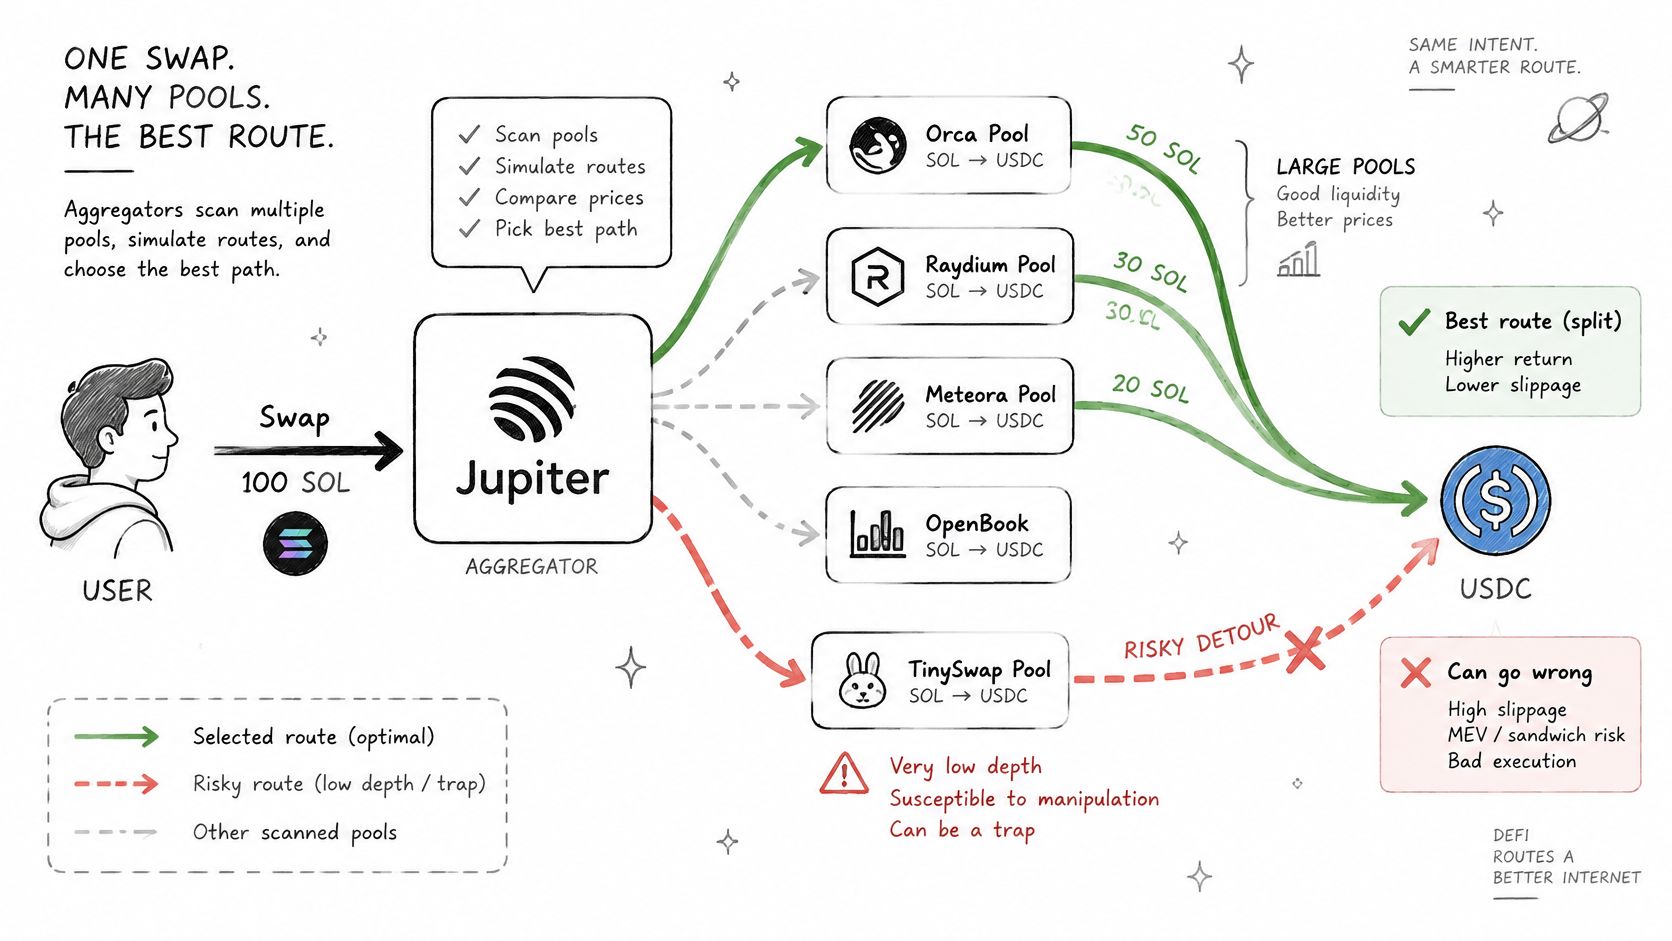
Most Solana swaps don't go directly to one pool. An aggregator such as Jupiter searches several pools for the best quote and may split your order across venues to improve the average price. That routing step is where several quiet problems enter, because the best quote on screen isn't always the safest fill.
The diagram below shows how a single swap can fan out across multiple pools before settling.
Where a Good Quote Turns Bad
A route can pass through a thin pool because the quoted price there looks attractive for a small slice of your order. The fill then moves that pool's price hard, or leaves you holding tokens whose real exit sits in a different pool entirely. Split routes also mean your effective price blends several pools, so checking just one pool page doesn't describe your actual trade.
Duplicate pools create a sharper trap. Anyone can create a copycat pool with a similar name or a near-identical-looking token address. A quote from the copycat may appear better than the actual market because its shallow reserves produce a misleading spot price. Always confirm the token mint address character by character, not the ticker or logo, before trusting a route.
Migration is the third weak point. Tokens launched on pump.fun trade on a bonding curve first, then graduate to a Raydium pool. The first pool after migration often starts shallow and moves violently as curve buyers and new buyers collide. A route quoted seconds before migration completes may not reflect the pool you'll trade against.
The walkthrough below shows a swap moving from quote to fill, which makes the routing and slippage settings easier to picture.
Settings and Sandwich Attacks
Your slippage tolerance tells the router how bad a fill you'll accept. Set it high and the trade executes at a poor price without asking again. Set it very low and transactions fail repeatedly in a fast market, which tempts people to crank it up at exactly the wrong moment.
A loose setting also invites sandwich attacks, where a bot buys just before your trade to push the price up, lets your order fill at the inflated price, then sells immediately after. The bot pockets the difference your tolerance allowed.
Three habits cut most of this risk:
- Compare the route with the pool page: Confirm the pools named in the route match the deep, established pool you checked.
- Count the pools: If a token trades in several pools, know which one carries real depth and which are copycats or leftovers.
- Keep slippage tight enough to refuse surprises: A failed transaction costs a small fee. A bad fill can cost a large share of your position.
Rug Pulls, Soft Rugs and Wash Trading Signals
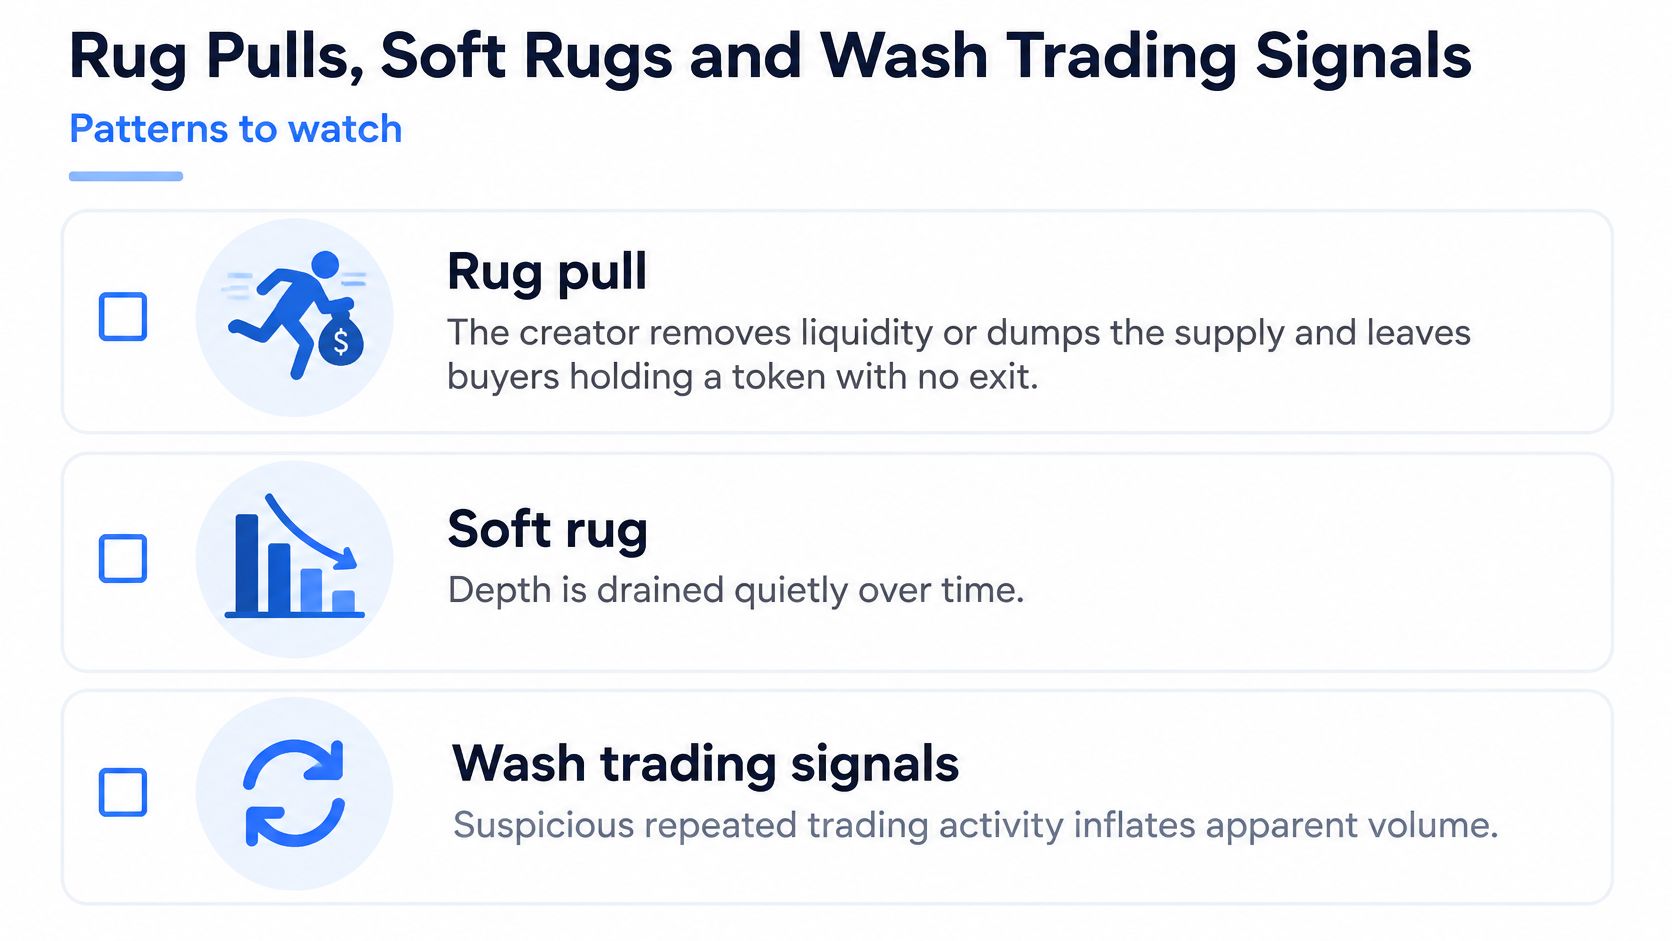
A rug pull is when the creator removes liquidity or dumps a large share of supply, leaving buyers holding a token with no workable exit. A soft rug is quieter. Depth drains gradually through withdrawals or steady insider selling, with no announcement, until the pool is too thin to sell into at any reasonable price.
Signals Worth Checking in Order
Work through these in sequence, because the earliest items are the hardest to explain away.
- LP removal transactions: Withdrawals by the creator or top LP holders directly reduce your exit depth.
- Creator wallet sales shortly after launch: The person who made the token selling into early buyers is a direct conflict with the story buyers were told.
- Bundled buys in the first blocks: Wallets that appear connected buying together at launch can hold a coordinated share of supply.
- Many buys from very few unique wallets: Trade count looks healthy while the actual buyer base is tiny.
- Repeated identical trade sizes: The same amount appearing again and again suggests scripted bots rather than varied human orders.
Wash Trading and Inflated Activity
Wash trading means the same party, or coordinated wallets, trade back and forth with themselves so volume looks real. Nobody new is taking risk, but the volume to liquidity ratio climbs, rankings improve, and outside buyers read the activity as demand. Learning to spot the timing and repetition patterns behind it is covered in depth in this guide on how to detect wash trading on Solana.
The practical tell is mismatch. Volume is high, yet unique wallets stay flat, trade sizes repeat mechanically, and price barely responds to all that supposed activity. Real demand from many independent buyers looks messier than that.
Separating Noise From a Planned Exit
One large sell doesn't prove a rug. Early buyers take profit, and a single whale exiting can be ordinary trading. The picture changes when signals arrive together. LP withdrawal plus creator selling plus a sudden drop in unique buyers points toward a planned exit being executed in stages, not coincidence.
Judge clusters, not incidents. Three weak signals pointing the same direction outweigh one dramatic candle.
Timing matters too. Keep watching the pool across the following day rather than only at launch. Liquidity that looks stable in the first hour can thin out within hours as insiders finish distributing. Check whether reserves, top holders and unique buyer counts at hour twelve still match what you saw before buying. If depth is shrinking while the creator's connected wallets keep selling, the trend is your answer, whatever the social channels are saying.
Finally, separate removable liquidity from executable depth one more time in practice. A soft rug often leaves some liquidity on the page, so the pool doesn't look empty. Run a realistic sell quote for your full position size. If the quoted return has collapsed compared with the displayed price, the exit is already gone, even though a liquidity number still exists.
Confirm Your Exit Route Before You Buy
Everything above reduces to one decision. The question isn't whether the pool looks large. It's whether you can exit at a price you accept, under conditions worse than the ones showing now. Run this exit test before opening a position, in this order.
- Set your maximum position size in dollars before you open the chart, so excitement doesn't set it for you.
- Divide that size by the token reserve in the pool to get the percentage of the reserve your eventual sale represents.
- Read the expected price drop for that percentage and convert it into dollars lost on exit.
- Confirm LP lock or burn status and whether the removable liquidity held by one wallet could disappear before you sell.
- Check the aggregator's route and count how many pools trade the same token, so you know which pool you'll really exit through.
- Set slippage tolerance low enough to refuse bad fills rather than authorize them in advance.
- Make a small test swap to confirm the route, the fees and the actual fill price against the quote.
- Walk away if the expected exit cost exceeds the loss limit you set in step one.
Using a Live Check and Knowing Its Limits
Doing those steps manually for every token takes time, so a live Solana exit liquidity checker can run the core of it for you. We built our checks so MemeAssist examines available liquidity and possible difficulties in opening or closing a position, alongside holder, creator and wallet checks in the same report.
Be clear about what any such report can't do. A token can pass MemeAssist's checks and still collapse because demand disappears, large holders sell, liquidity changes, or new information appears. No score at the moment of analysis controls what other holders do afterward.
Plainly stated: MemeAssist users can lose all of the money invested in a memecoin, even without a rug pull. A clean liquidity check lowers specific risks. It never makes a meme coin safe.
Size every position as if the exit could be worse than your test suggested. If losing the full amount would change your finances, the position is too large, whatever the pool metrics say.
Before your next Solana buy, put the token address through a check that examines available liquidity, LP status, holder concentration and creator activity together, then read the exit cost in plain language rather than guessing from a headline liquidity number. Visit MemeAssist to run that liquidity and exit check on the exact pool you're about to trade against, and only proceed if the expected exit cost fits the loss limit you set first.