Liquidity Risk Analysis for Solana Meme Coins
Master liquidity risk analysis for Solana meme coins. Learn to spot manufactured volume, test real pool depth, and automate safety checks before you trade.
Published
Updated
The worst advice in Solama meme coins is still the most repeated one: look for a big pool and strong volume, then assume you can get out. That shortcut ignores the part that matters most, because a token can look liquid on a dashboard and still turn into a trap when real sellers hit the book. Liquidity risk analysis is about separating what is displayed from what is executable.
Traditional stress testing already taught markets this lesson. The question is no longer whether liquidity exists in name, it's whether that liquidity survives pressure, resists manipulation, and lets you exit without getting crushed on price.
Table of Contents
- The Illusion of Deep Pools and High Volume
- Translating Traditional Stress Tests to On-Chain Markets
- Identifying Manufactured Liquidity and Insider Clusters
- Diagnostic Tests for the First Hour of Trading
- Automating Risk Screens with MemeAssist
- Integrating Risk Signals into Active Trade Setups
- Building a Sustainable Solana Trading Workflow
The Illusion of Deep Pools and High Volume
A large pool and a busy chart don't prove that a trade can be unwound safely. They only prove that numbers are moving. The Bank for International Settlements defines a liquid market as one where transactions can occur rapidly with limited price impact, which is why liquidity risk analysis has to ask not just whether an asset can be sold, but how much the sale moves the market price. During stress, even traditional measures can fail badly, since bid-ask spreads widened to as much as four times normal levels in BIS research, showing how quickly apparent depth can disappear (BIS research on liquidity under stress).
Manufactured liquidity looks real until someone tries to exit
On Solana, the illusion is often created with wash trading, bundled wallets, or self-referential buys that inflate apparent demand. A dashboard sees volume and infers participation, but that volume may just be a loop of wallets trading with themselves or a coordinated cluster cycling inventory to keep the chart lively. The more dangerous part is that these tactics can make a pool look healthy right up until the first genuine seller pushes through.
Practical rule: treat high volume as a question, not a reassurance. Ask who is generating it, who controls the pool, and whether the same wallets appear on both sides of the trade.
That is why liquidity quality matters more than liquidity quantity. A token can have visible depth and still deliver severe slippage if the displayed demand is artificial or quickly withdrawable. For a trader, the key issue is not whether a pool exists, but whether it contains broad, durable participation that can absorb size without collapsing.
If you want a practical way to spot this pattern, start with a focused wash-trading review like this Solana-specific guide. The goal isn't to prove fraud in a legal sense. The goal is simpler, decide whether the market you're about to enter is real enough to exit.
Translating Traditional Stress Tests to On-Chain Markets
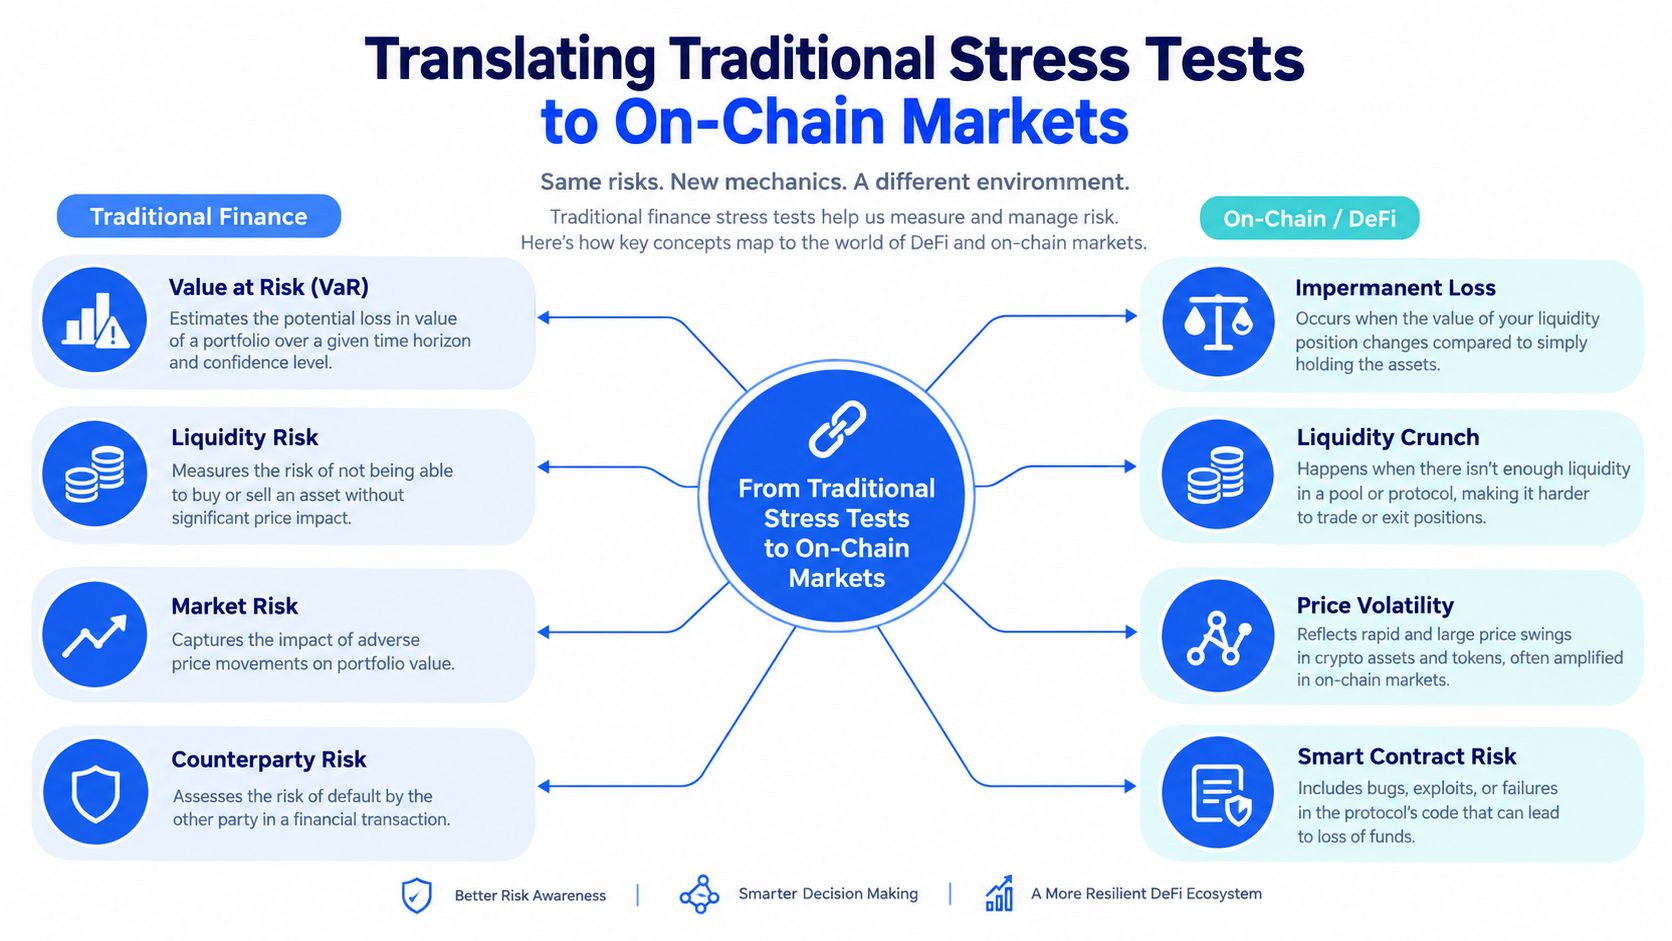
Traditional finance already gives the right framework. Liquidity risk analysis became central after the Asian financial crisis of 1997 and the turbulence in mature markets in autumn 1998, because analysts learned that a market can function normally until stress reveals how thin it really is. The core distinction is between funding liquidity, the ability to obtain cash, and market liquidity, the ability to sell an asset without severe price concessions. Those are related, but they're not the same problem.
A pool is not cash until it survives the exit
The Federal Reserve's 2008 crisis research shows why this matters. Excluding central-bank swaps and assistance to specific institutions, the Fed expanded liquidity by approximately $600 billion during 2008, most of it in the final two quarters, because markets were seizing up (Federal Reserve research). That's the same logic a meme coin trader should apply to a Solana pool. A reported pool balance is not the same thing as immediately realizable cash.
An on-chain stress test should assume shocks, not stability. It should ask what happens if sellers hit the pool at the same time, if spreads widen, if liquidity providers step back, or if the exit itself forces price down enough to worsen the next sale. The practical checklist is straightforward:
- Withdrawal shock: what happens if liquidity gets pulled or reduced?
- Concurrent selling: how does the pool behave if several holders exit together?
- Execution quality: how much slippage appears when the trade size rises?
- Price resilience: does the chart recover, or does each sale push it lower?
- Funding access: can the token still be sold, or is trading effectively blocked?
For thinly traded digital assets, this is the key shift in thinking. Reported value is not the same as sellable value. Once that distinction is clear, a trader stops treating pool size as a guarantee and starts treating it as one input inside a stress scenario.
Identifying Manufactured Liquidity and Insider Clusters
The hardest problem isn't spotting liquidity, it's deciding whether the liquidity is organic. Standard screens often stop at pool depth and trading volume, but that misses coordinated buying, bundled wallet activity, and price inflation from tiny trades. A cross-chain study of 34,988 meme coins found that 82.8% of tokens generating returns above 100% showed evidence of artificial growth, including wash trading and liquidity-pool-based price inflation. It also linked early signals to later pump-and-dump and rug-pull behavior, with more than 17,000 victimized addresses and realized losses above $9.3 million (cross-chain study).
What the data footprint usually looks like
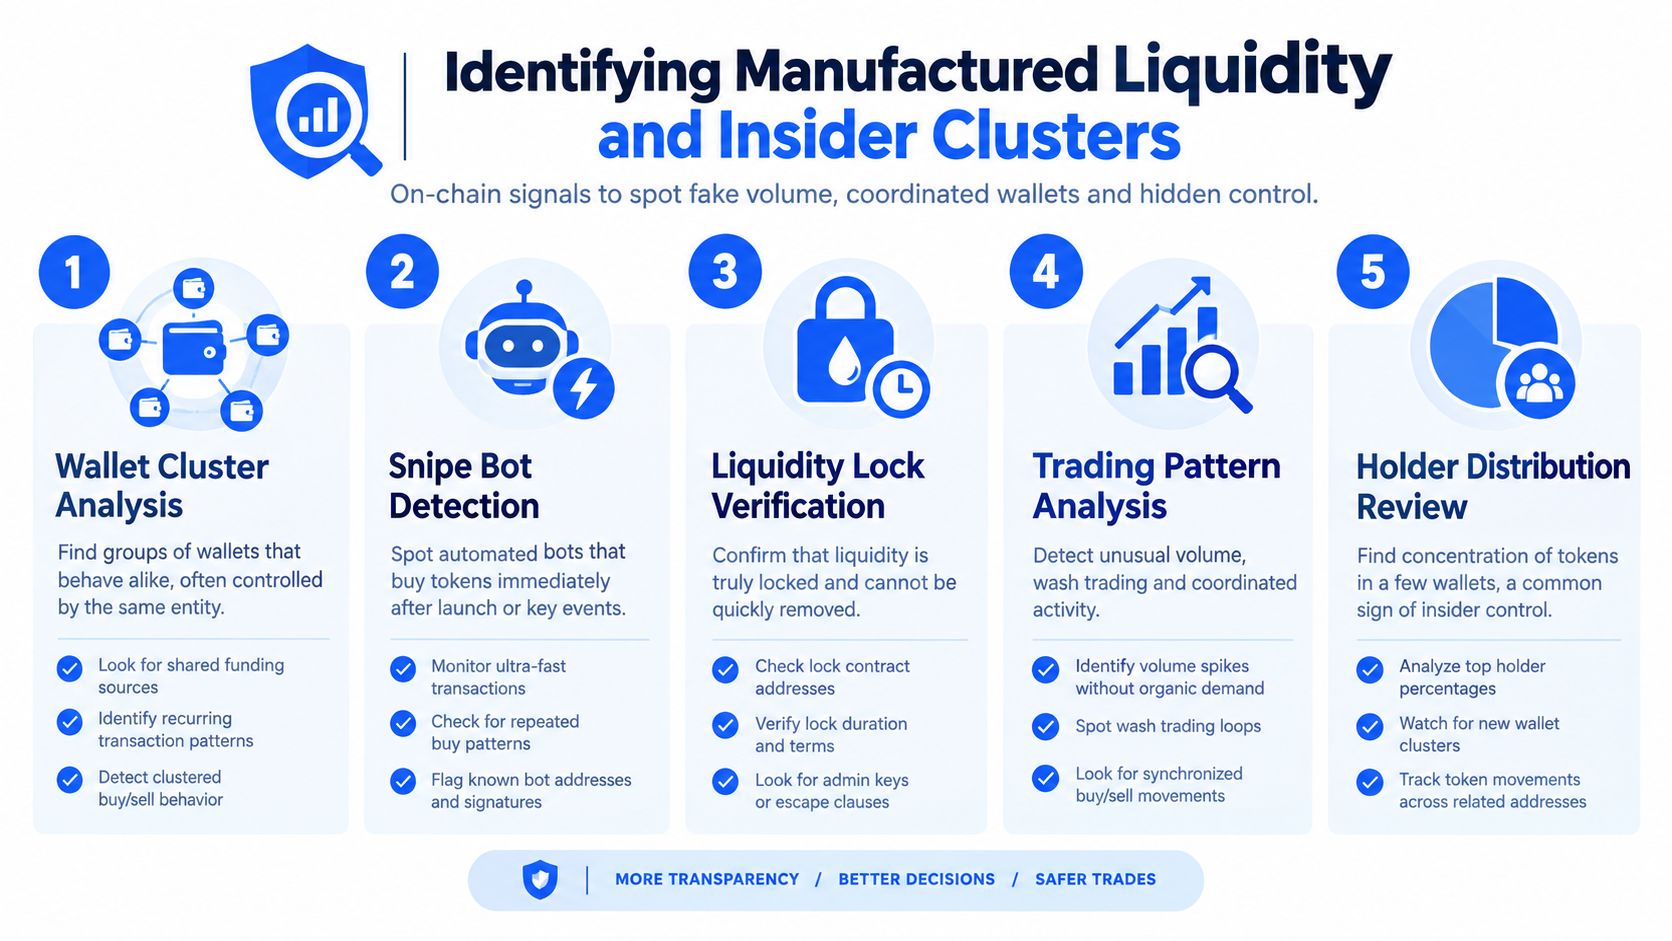
Manufactured liquidity rarely hides in one signal. It shows up as a pattern. The same wallets trade repeatedly, buys cluster tightly in time, and liquidity providers also appear on the sell side. That doesn't automatically prove a scam, but it does tell you the market may be narrower than the dashboard suggests. Broad participation leaves a messier footprint. Coordinated flow looks clean, too clean.
A pool can look deep and still be easy to drain if the “buyers” are the same small set of wallets feeding the chart.
The right diagnostic question is simple. How much of the displayed liquidity and volume would remain if suspicious wallets, bundled trades, and self-referential activity were removed? That question matters because suspicious flow can inflate both demand and confidence at the same time. If you only measure quantity, you miss the quality problem entirely.
For Solana traders, that means checking concentration at the wallet level, not just the holder list. It also means watching whether liquidity providers are active traders in the same token, because that overlap often signals a market that can be turned off the moment insiders finish distributing. If you want to map that structure visually, wallet cluster analysis is a useful starting point.
The best mental model is this, if liquidity can be created by the same small group that can later remove it, then the pool is closer to a staged set than a market. That's not a theory problem. It's an exit problem.
Diagnostic Tests for the First Hour of Trading
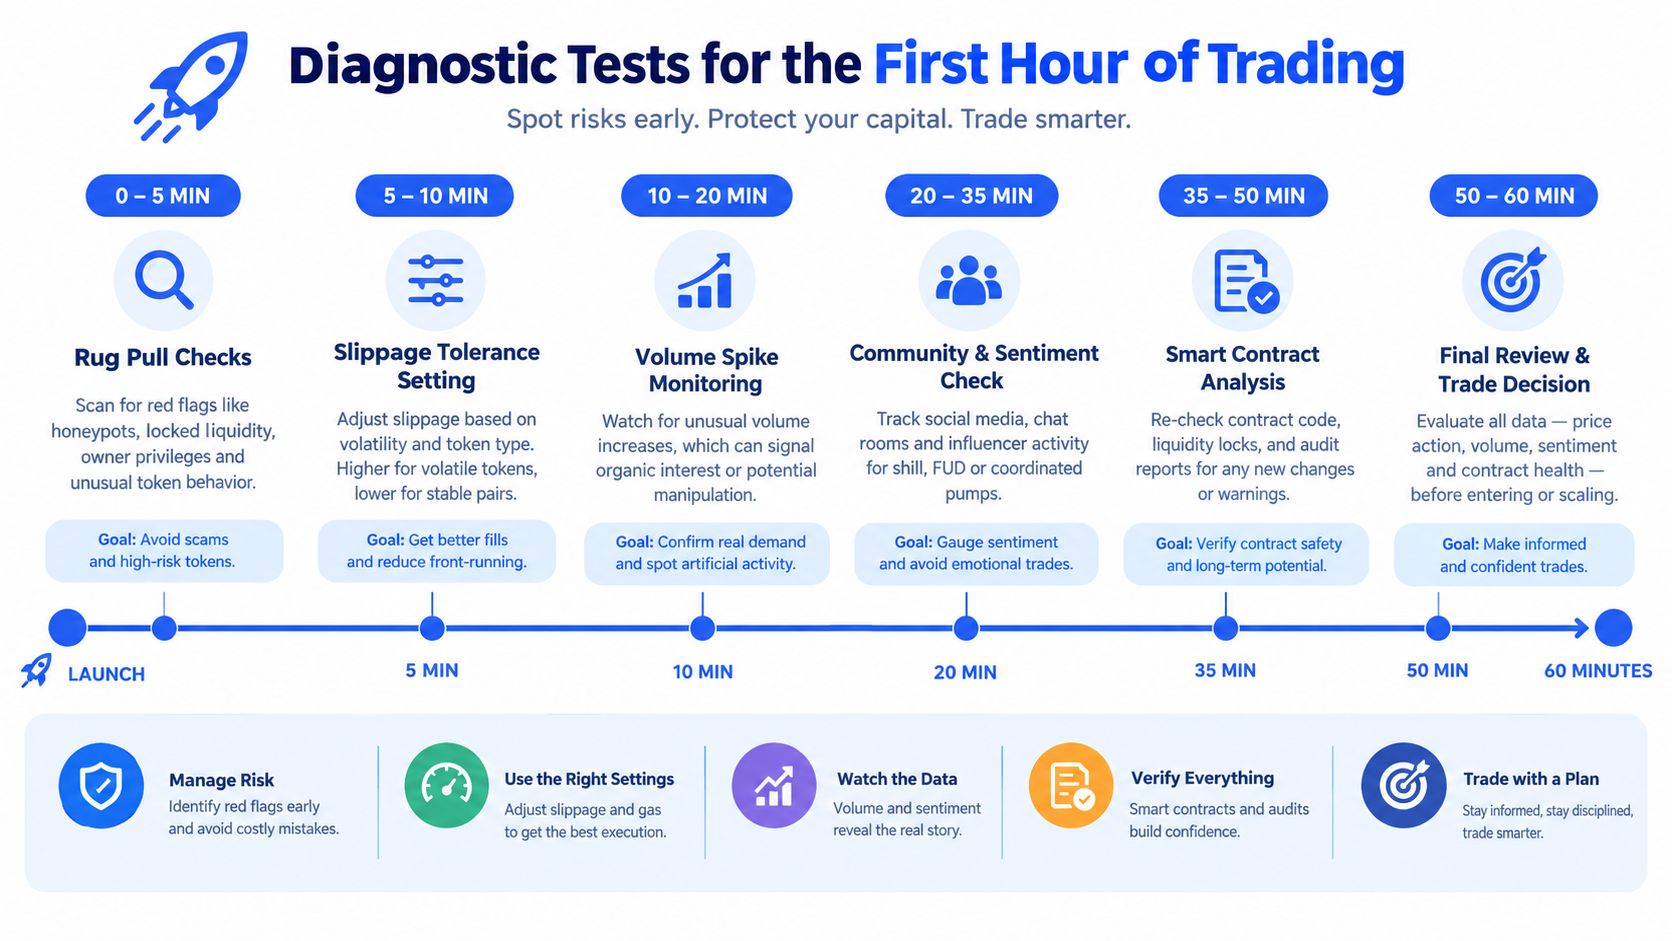
The first hour tells you more than the first week. A recent large-scale study of 6.4 million Solana memecoins over seven months reports that most tokens display rug-pull characteristics within one hour of launch, and that gradient-boosting models can detect potential rugs using only the first five minutes of trading data (Solana memecoin study). That's the useful lesson. If the danger window is front-loaded, your checks need to be front-loaded too.
The first minutes tell you whether a market is real
Start with initial liquidity behavior. A token that launches with visible depth but unstable balances is already telling you something. Watch whether sell orders execute cleanly, whether price impact escalates too quickly, and whether the pool balance changes in a way that suggests liquidity is leaving rather than just rotating. A sudden trading stop can matter just as much as a drain, because a token that can't be traded is effectively dead even if some value still appears in the pool.
Practical rule: a launch that feels “fine” but only because nobody has tried to sell yet is not safe. It's untested.
A good first-hour workflow is direct:
- Check opening liquidity movement. If balances swing sharply right after launch, don't assume that's normal activity.
- Probe sell-side execution. If small sells create exaggerated price damage, the pool can't absorb stress.
- Watch for cluster behavior. Repeated buying from the same pattern of wallets is a warning sign, not proof of demand.
- Separate withdrawal from cessation. Funds can leave the pool, or trading can freeze while the token still appears to exist.
- Reassess after every abnormal move. Early behavior matters more than the name, narrative, or creator history.
For a fast scan, this exit-liquidity checker gives you a direct way to pressure-test whether a token can be sold. That's the entire point of early liquidity risk analysis. You're not trying to admire the chart. You're trying to find out whether the market will let you leave.
Automating Risk Screens with MemeAssist
Manual screening is too slow when a token can move from launch to trap in minutes. Block explorers, bubble maps, and separate slippage checks all have value, but they spread your attention across too many tabs and too much delay. A live risk screen that ingests fresh data at the moment of analysis is better suited to Solana's pace, especially when the key question is whether the displayed liquidity is usable or staged.
What a live diagnostic report should surface
One useful approach is to collapse the checks into a single report with an Overall Health Score, a Rug Risk Rating, a plain-English AI Verdict, and a Detailed Risk Breakdown. Those outputs matter because they force the signal into a format a trader can use quickly. A score without explanation invites false confidence. A paragraph without evidence invites guesswork.
MemeAssist is one option that does this on Solana. It combines live on-chain and market data across liquidity, holder distribution, creator behavior, wallet activity, trading patterns, and historical risk indicators, then presents the result as a report you can review without connecting a wallet. It also uses a pay-as-you-go model rather than a subscription, which fits traders who want to screen a token before risking capital.
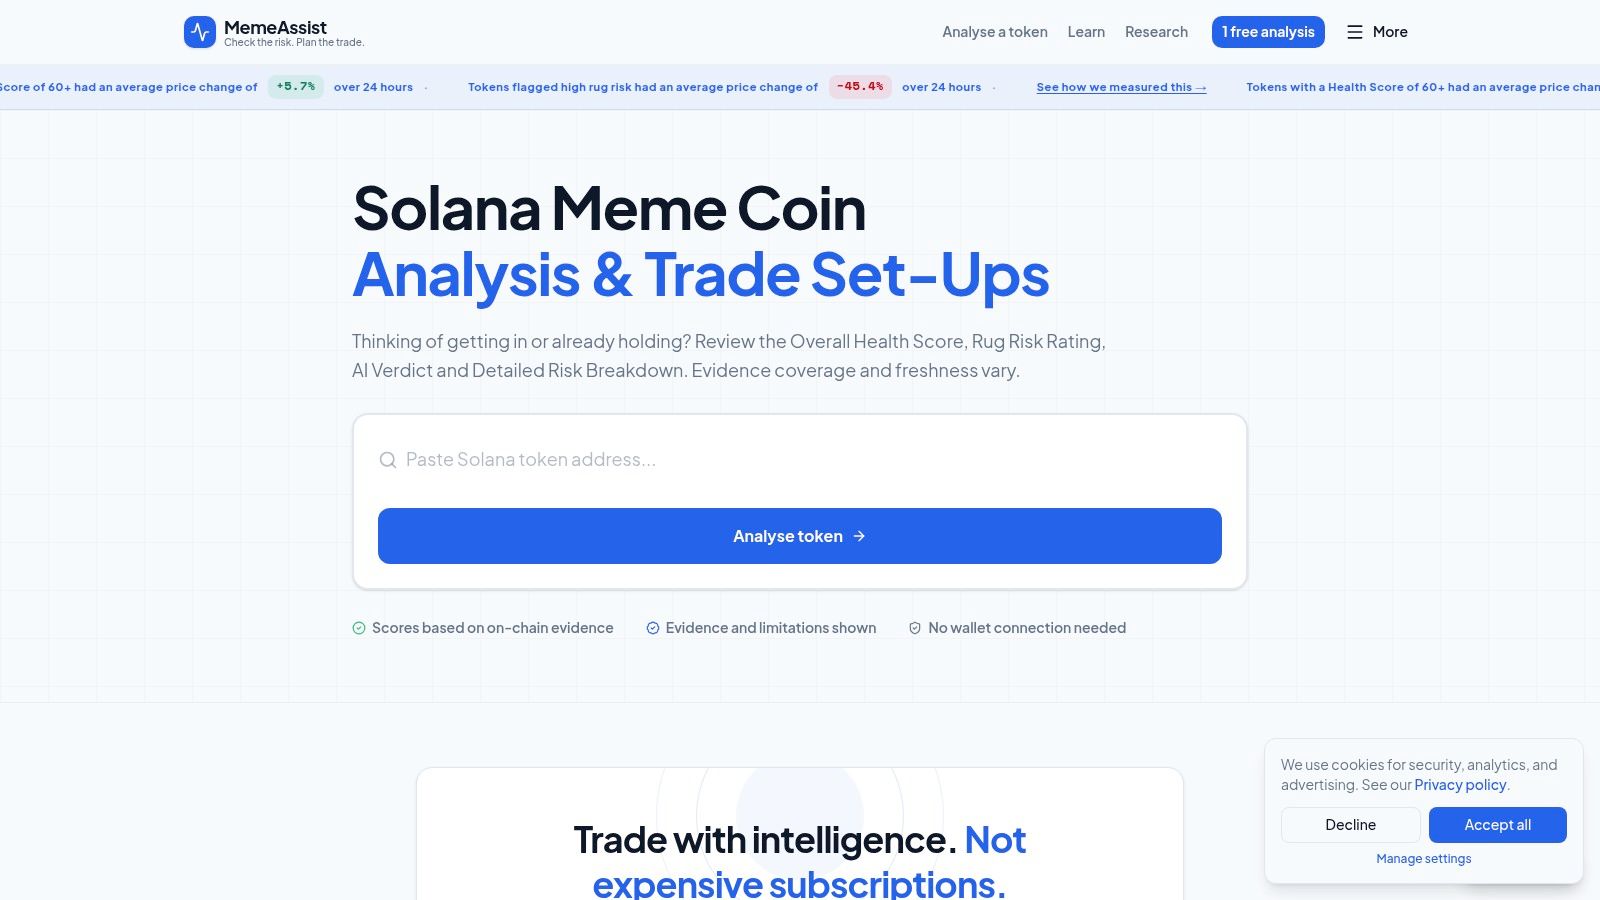
The core advantage of automation isn't just speed. It's consistency. A manual process can miss the same red flag twice, especially when a chart is moving fast and the wallet patterns are noisy. A structured report keeps the same evidence categories in view every time, which makes comparison across tokens much easier.
If you're evaluating tools, the real test is whether the screen helps you answer one question fast, can I sell if I need to? If the answer isn't clear, the token isn't clear either.
Integrating Risk Signals into Active Trade Setups
A clean trade setup starts with a pass-fail decision, not with hope. Suppose a new Solana meme coin is trending, the narrative is loud, and the chart is green. The wrong move is to size first and investigate later. A better workflow is to let the risk screen decide whether the token deserves further attention, then use the chart only after the liquidity check says the market is usable.
A buy decision needs more than momentum
If the report gives you a benign Rug Risk Rating but the Detailed Risk Breakdown still flags uneven wallet concentration, you don't need to force a buy. You can treat that as a smaller position or a shorter hold time, because the exit quality is part of the trade, not an afterthought. If the AI Verdict warns that the pool looks thin relative to expected selling pressure, that's a pass even if social sentiment is strong.
Here, the output format matters. A numeric score alone can tempt traders into overfitting. The narrative verdict helps explain whether the concern is liquidity withdrawal, insider clustering, or suspicious trading flow. That context lets you distinguish a token that's merely volatile from one that's structurally hard to exit.
Useful habit: size the trade as if the exit will be harder than the entry. If that feels uncomfortable, the position is probably too large.
In practice, the decision tree is simple. If the report shows clean liquidity, no obvious cluster concentration, and no signs that recent volume is manufactured, the token can stay on the watchlist or enter a small test position. If the report shows unstable pool behavior or severe execution risk, pass. If the report is mixed, treat it as a marginal setup and keep the allocation small enough that a bad exit won't alter your day.
The point isn't to eliminate risk. It's to make sure the risk is visible before the trade is live. Once you start reading liquidity as an exit condition instead of a backdrop, your entries get cleaner and your losses stop getting mysterious.
Building a Sustainable Solana Trading Workflow
Long-term survival in Solana meme coins depends on one habit, treating liquidity quality as the survival metric. Price can recover. A bad exit often can't. That's why liquidity risk analysis should sit next to your narrative checks, not behind them. If the market structure is fake, the story doesn't matter much.
A simple discipline to keep
Use the same screening sequence every time. Check whether the pool looks real, whether the volume is broadly distributed, whether the first minutes show stable execution, and whether wallet clusters suggest coordination. Then ask one final question, can this token still be sold if the market turns fast? If the answer is unclear, the position size should shrink or disappear.
Liquidity quality is the edge that keeps you in the game. Everything else is secondary when exits get crowded.
The best traders don't confuse activity with depth. They know a busy chart can hide a fragile market, and they refuse to pay for that mistake twice. They also keep learning, because scam patterns evolve and the signals that worked last month can get stale quickly. A tool that tracks outcomes and refines its heuristics over time is more useful than one that only repeats yesterday's heuristics.
If you want a faster way to apply that discipline, MemeAssist screens Solana tokens with live risk checks, live evidence, and plain-language verdicts you can act on before you click buy. Use it as a pre-trade filter, then keep your own exit rules strict enough to survive the next bad launch.