10 Most Common Trading Patterns on Solana Meme Coins
Explore the 10 most common trading patterns on Solana meme coins, from head and shoulders to triple tops, and how to check them with on-chain data.
Published
Updated

Most guides teach most common trading patterns as if the chart draws itself. On Solana meme coins, that's the wrong order of operations. A clean head and shoulders, triangle, or flag can be manufactured by a small set of wallets, a thin book, or wash-heavy activity, so the shape is only the starting signal. The question is whether the price structure survives on-chain checks for holder concentration, liquidity depth, and bundle activity.
That matters because momentum and reversal are conditional patterns, not universal rules. Momentum can persist over intermediate horizons, then reverse later, while short-term reversals often reflect delayed adjustment rather than a clean trend change, as documented in classic equity research on momentum and trader-size effects (Jegadeesh and Titman's momentum study, short-term reversal and trader-size evidence). On Solana, that distinction gets sharper because reported volume can be misleading, wash trading can dominate, and patterns can appear in markets where the same wallets shape both price and sentiment (wash-trading evidence).
The list below keeps the classic formations, but treats each one as a price hypothesis, not proof. It also asks the extra question meme coin traders face, whether the move is tradable after slippage, fees, and thin liquidity. That is where wallet concentration, liquidity checks, and bundle detection, including the kind MemeAssist surfaces in its reports, become the difference between a chart that looks right and a trade that holds up.
Table of Contents
- 1. Head and Shoulders and Inverse Head and Shoulders
- 2. Double Top and Double Bottom
- 3. Triangles Ascending, Descending, and Symmetrical
- 4. Bull Flag and Bear Flag
- 5. Pennant
- 6. Rising Wedge and Falling Wedge
- 7. Cup and Handle
- 8. Rectangle or Trading Range
- 9. Rounding Bottom or Saucer Bottom
- 10. Triple Top and Triple Bottom
- Top 10 Trading Patterns Compared
- Pair Every Pattern With On-Chain Evidence Before You Trade
1. Head and Shoulders and Inverse Head and Shoulders
A head and shoulders top is a reversal structure, not a prediction machine. Price makes a higher peak in the middle, then fails to hold those highs on the right shoulder, and a break below the neckline shows that buyers no longer have the same control. The inverse version says the opposite, a deeper middle trough can mark exhaustion, then a break above the neckline suggests sellers are losing grip.
On Solana meme coins, the shape can be real while the meaning is wrong. A small cluster of wallets can paint the three peaks, especially if liquidity is shallow and the same addresses keep rotating supply. That's why a neckline break matters less than the context around the break, including whether large holders are exiting and whether liquidity is still deep enough to support follow-through.
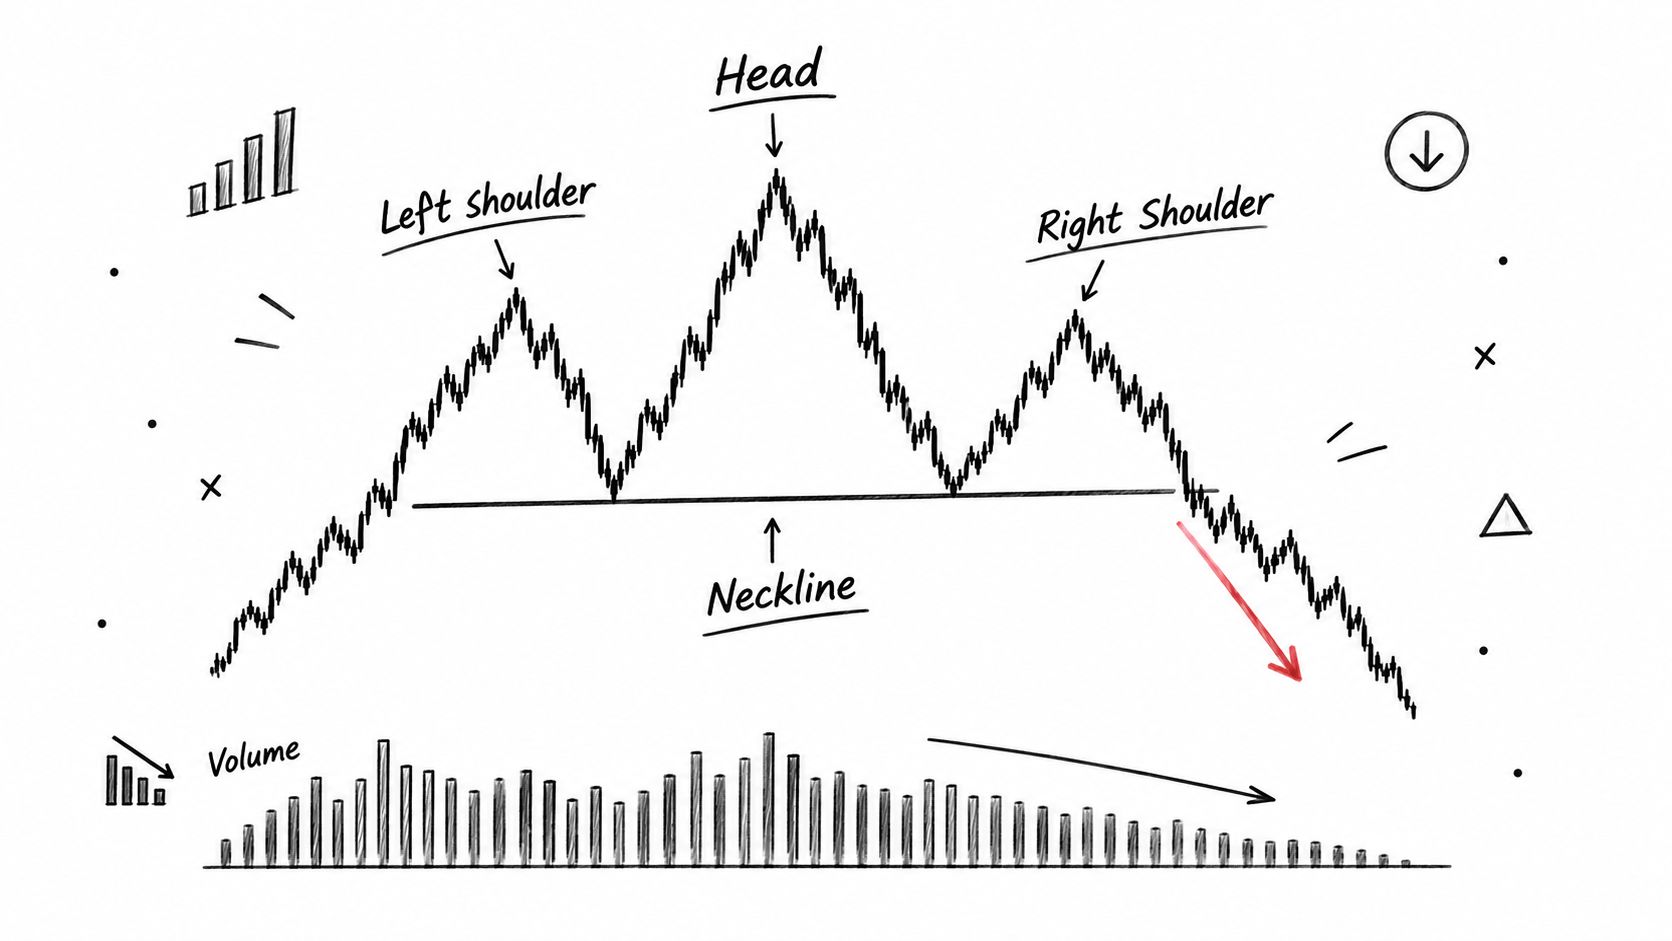
Practical rule: wait for a close beyond the neckline, not just an intraday wick.
A few checks matter more than the outline itself:
- Volume through the pattern: contraction into the right shoulder and expansion on the break is more meaningful than a flat price-only move.
- Holder exits: if top wallets trim heavily into the break, the pattern carries more weight.
- Liquidity stability: a neckline break into thin depth is easier to fake.
- Stop placement: the right shoulder is the invalidation zone, not the first retest.
For timing work, MemeAssist's entry and exit timing guide fits here because the pattern only becomes tradable after confirmation, not during formation. Thomas Bulkowski's long-running chart-pattern work, while based on equities, is a reminder that exact definitions and market conditions matter more than the label.
2. Double Top and Double Bottom
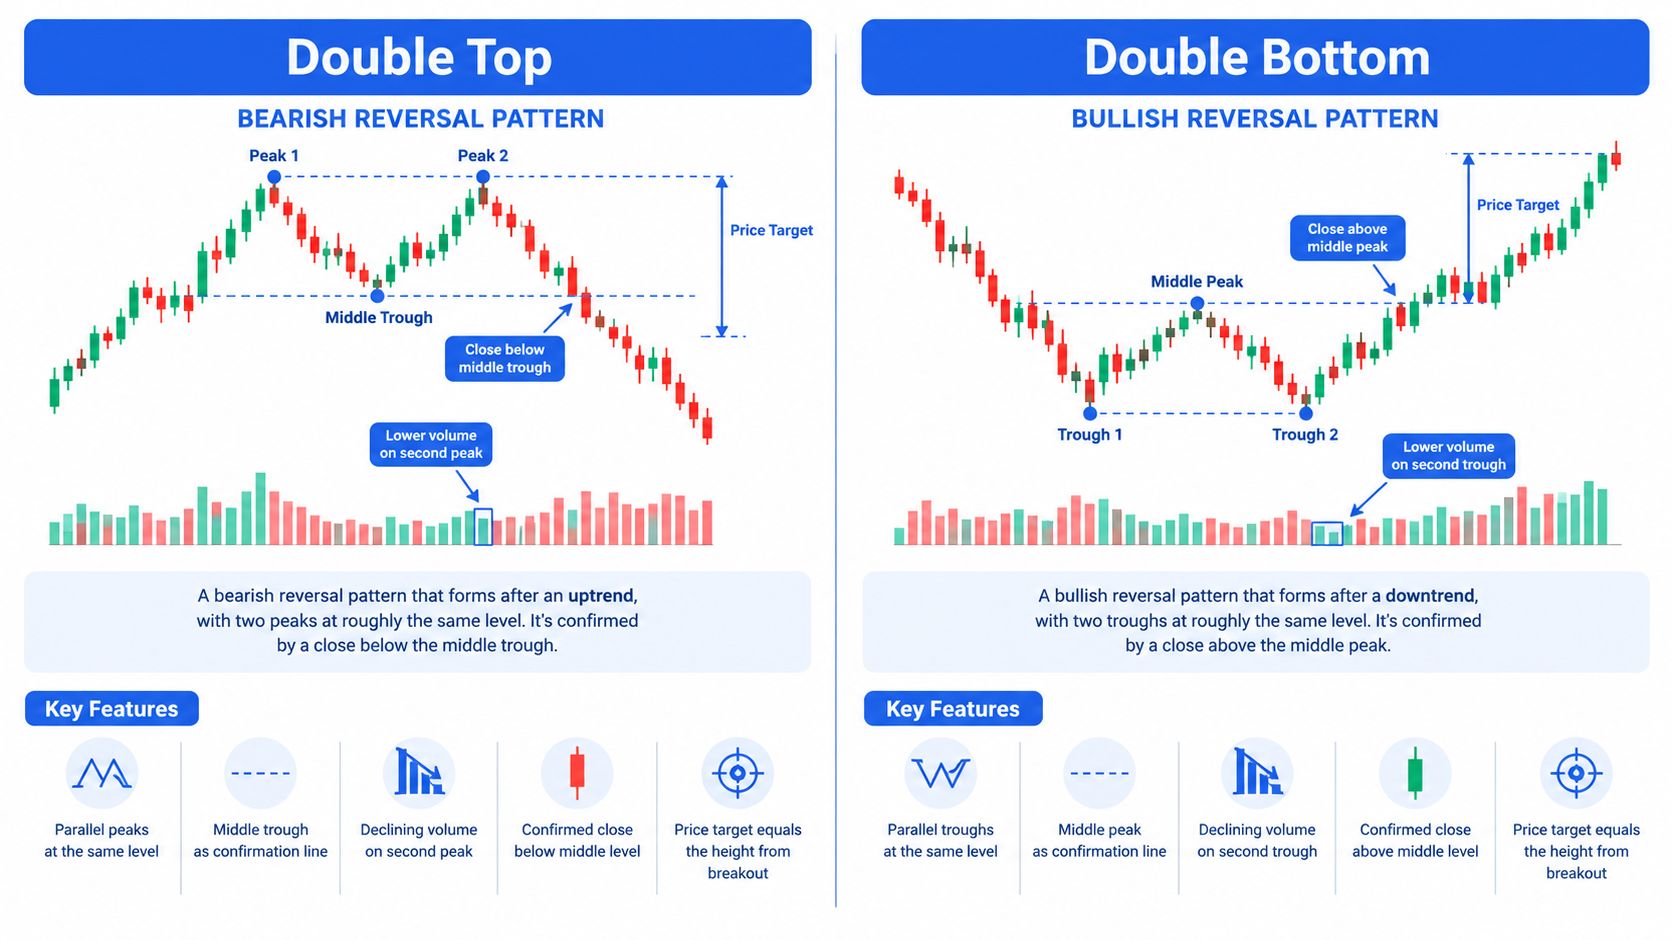
A double top is simple to read and easy to misread. Price hits roughly the same resistance twice, fails to break higher, and then loses the midpoint support. A double bottom is the mirror image, price tests support twice, buyers absorb the selling, and a breakout above the middle peak shows that demand is taking control.
The simplicity is why it's popular on meme coins. Traders see a clean second test and assume it means something. It can, but only if the second test came from broad participation rather than a few repeated wallets defending or distributing the same supply.
On thin Solana markets, the second peak or trough can be manufactured by concentrated participation. That's why the key question isn't just whether the highs match, it's whether the second test came with weaker breadth, different wallet behavior, and weaker liquidity response than the first. Repeated tests from the same cluster of buyers or sellers are a warning sign, not confirmation.
A double top or bottom only earns respect when the market shows different behavior on the second test.
Use a tolerance band for the two extremes, but keep it tight enough that the level still means something. Then compare the two attempts:
- Volume profile: a softer second peak or trough is more constructive than a repeated burst of activity.
- Wallet composition: new buyers on the breakout are stronger than a recycled set of holders.
- Support behavior: a double bottom that holds while depth improves is more credible than one that bounces on air.
- Entry discipline: don't act on the first touch of support. Wait for a close that confirms the level gave way or held.
The chart pattern tells you where the market paused. It does not tell you who controlled the pause.
3. Triangles Ascending, Descending, and Symmetrical
Triangles are compression patterns. The range narrows, volatility drops, and the market builds toward a decision. An ascending triangle leans bullish because buyers keep stepping in at higher lows while resistance stays fixed. A descending triangle leans bearish because sellers keep leaning on a flat support. A symmetrical triangle is neutral until the market chooses a side.
That structure is familiar across markets, but meme coins distort it fast. On Solana, a triangle can form because buyers are absorbing supply, or because a handful of wallets are managing the tape inside a shallow book. The difference shows up in whether the eventual break comes with new unique buyers and real depth behind it.
The breakout matters more than the pattern's outline. A triangle that resolves into a thin order book often snaps back because there isn't enough liquidity to sustain continuation. A triangle that breaks with broader participation and stronger depth has a better chance of surviving the first retest.
What to verify before acting
- Close outside the trendlines: wicks are noise, closes matter.
- Volume expansion: a valid break should not happen on dead participation.
- Buyer breadth: new wallets are stronger evidence than repeated activity from the same set.
- Liquidity depth: thin books turn triangles into traps.
MemeAssist's Solana trade setups versus backtesting guide is relevant here because backtested pattern logic means little if the live market is too thin to execute. The triangle is a setup. The order book decides whether it is tradable.
4. Bull Flag and Bear Flag
Flags are continuation patterns, and they're popular for a reason. A sharp move creates the flagpole, then price pauses in a small counter-trend channel before resuming in the original direction. A bull flag follows a strong rise and resolves upward. A bear flag follows a steep drop and resolves lower.
On meme coins, flags can look textbook and still be fragile. A brief pause after a sharp move may be healthy consolidation, or it may be a distribution window where early wallets unload into late demand. The visual is the same. The wallet behavior is not.
That's why flags need a context check. If the flag holds while unique holders keep rising, the structure looks more constructive. If holder count fades while price sits still, the pause may be masking exhaustion. In a Solana market, the difference is often more useful than the flag itself.
Practical rule: a flag is only worth trading if the market keeps broadening while it pauses.
A few filters improve the setup:
- Flagpole quality: strong impulse first, then consolidation second.
- Retracement depth: a flag that gives back too much of the move is less useful.
- Volume during the pause: quieter action inside the channel is more consistent with continuation.
- Holder trend: rising unique holders makes the pause healthier.
The image of a clean flag often tempts traders to enter early. The better entry is the one that survives the first push through the channel boundary and still has participation behind it. That's where the pattern stops being a drawing and starts being evidence.
5. Pennant
A pennant is a close cousin of the flag, but the consolidation tightens into a small triangle instead of a parallel channel. Price moves sharply, then compresses into converging lines, and the breakout usually follows the direction of the prior move. The logic is the same as a flag, momentum pauses, then either resumes or fails.
Short timeframes make pennants look everywhere. On Solana meme coins, that's a problem. Micro ranges can appear from noise, liquidity gaps, or a few matched trades, so the shape alone is weak evidence. The pattern only gets stronger when the initial move was strong and the breakout finds fresh participation rather than just recycled flow.
That is why pennants should be treated as a momentum continuation test, not a standalone signal. If the pole was weak, the pennant is just congestion. If the pole was strong but the breakout stalls, the market is telling you the impulse didn't attract enough follow-through.
A clean way to judge it is to ask three questions:
- Was the pole real? The prior move needs to be strong enough to matter.
- Did activity broaden? New wallets and rising participation help confirm continuation.
- Did the breakout hold? A quick reclaim failure is a sign the market is still indecisive.
Pennants are tempting because they're compact. That same compactness makes them easy to fake in thin markets. Treat the setup as provisional until the move escapes the range with real depth behind it. On Solana, a tiny triangle can be a breakout or just a pause before the next liquidity sweep.
6. Rising Wedge and Falling Wedge
Wedges compress momentum. In a rising wedge, price keeps making higher highs and higher lows, but the structure tightens and momentum weakens. That often ends with a break down. In a falling wedge, price keeps making lower highs and lower lows, then the selling pressure fades and the market can break upward.
The key is not direction alone, it's slope and exhaustion. A rising wedge on a meme coin can look like healthy trend continuation right until the bids thin out and early holders distribute into strength. A falling wedge can look ugly until the last sellers run out of inventory and the market rotates higher.
That makes wedges especially sensitive to holder concentration. If the same wallets dominate the move, the wedge may reflect controlled distribution or accumulation rather than a broad crowd repricing the token. A wedge with shrinking volume and concentrated participation is far less convincing than one with broad on-chain involvement.
The pattern is most useful when the trendline touches are clear and the breakout respects the boundary. Otherwise, the wedge becomes just another noisy channel.
- Rising wedge: check for weakening volume and large-holder exits.
- Falling wedge: check for broadening ownership and a clean reclaim.
- Both versions: wait for a confirmed break, then assess whether depth supports the move.
- Risk control: place stops beyond the opposite side of the wedge, not inside the noise.
A wedge proves that momentum is changing. It doesn't prove which side will win unless the on-chain evidence agrees.
7. Cup and Handle
The cup and handle is one of the cleaner bullish continuation shapes. Price rounds out into a U-shaped base, then forms a smaller pullback on the right side, the handle. A breakout above the handle's resistance suggests the prior uptrend may be resuming. William O'Neil popularized the pattern in growth-stock work, and the basic logic still matters, a final shakeout can clear weak holders before the next leg.
On meme coins, the rounded base is the part that deserves the most scrutiny. A V-shaped bounce is not the same thing. A genuine cup reflects time, accumulation, and a slower shift in ownership. If unique holder count rises through the base, the structure is more convincing because the market is broadening while it consolidates.
The handle is the final check. A shallow pullback in the upper half of the cup is healthier than a deep retracement that gives back most of the base. Deep handles often tell you the market is not ready yet.
The cup is about accumulation. The handle is about whether that accumulation can survive pressure.
Use the following lens:
- Base shape: rounded is stronger than sharp.
- Holder growth: broader ownership during the base supports the pattern.
- Handle depth: the shallower pullback usually signals better control.
- Breakout quality: a clean close above the handle matters more than an intraday spike.
A cup and handle on Solana can be meaningful. It can also be a long, orderly distribution process dressed up as accumulation. The difference lives in the wallet data.
8. Rectangle or Trading Range
A rectangle is a horizontal battle between support and resistance. Price keeps bouncing between the same boundaries, and the market looks balanced until one side loses. A break above resistance usually favors continuation or reversal higher, while a break below support usually does the opposite.
This pattern is easy to see and easy to abuse. On meme coins, rectangles often appear because liquidity is thin and price is being held in a range by a few participants. That makes the range look cleaner than it is. If the same wallets are repeatedly defending the edges, the rectangle may be less a neutral balance and more a managed corridor.
That's why the range edges matter. A valid break should come on a close, not a wick, and should hold when the market retests the boundary. If depth disappears at the edges, the rectangle is fragile. If holder concentration rises while price stays pinned, the eventual move can be sharp and directional.
Practical rule: a range break is only useful if the market can hold the boundary after the first push.
MemeAssist's take profit versus trailing stop guide fits neatly with rectangles, because range breakouts can fail fast. A trader who takes partial profits into the break and trails the rest is usually better positioned than one who assumes every escape from the box will keep running.
A rectangle tells you where the market hesitated. It does not tell you whether the pause was healthy, forced, or engineered.
9. Rounding Bottom or Saucer Bottom
A rounding bottom is slow, which is why many traders miss it. Price drifts down, flattens, then turns up in a broad arc. The shift is gradual, not dramatic, and that gradualism is the point. It reflects a market moving from persistent selling into quiet accumulation.
On Solana tokens, this pattern is only convincing if the base broadens in ownership. A slow bottom formed by a few large wallets is not the same as a genuine saucer. If the holder count grows through the base and the right side starts to lift on steadier participation, the structure becomes more credible.
The weekly or monthly view matters more here than the intraday chart. Rounding bottoms unfold over longer horizons, and shorter charts can make the move look choppy or premature. Traders who force the pattern onto a 5-minute chart usually end up finding shapes that aren't really there.
- Use higher timeframes: the pattern needs room to form.
- Look for gradual participation: more holders in the base is better than a narrow cluster.
- Watch the right side: rising volume into the recovery is a useful confirmation.
- Don't anticipate the pattern too early: the right side has to exist before the saucer is real.
The saucer bottom is one of the few classic patterns that rewards patience more than speed. On meme coins, patience still doesn't excuse weak structure. It just gives the market enough time to prove it's actually changing.
10. Triple Top and Triple Bottom
Triple tops and bottoms are the more stubborn versions of the double pattern. Three failed attempts at the same resistance or support make the level harder to ignore. A triple top suggests supply is repeatedly overwhelming demand. A triple bottom suggests the opposite, repeated support tests are failing to push price lower.
The extra test matters because it usually comes when conviction is fading. In a meme coin, that can mean the market is running out of new buyers, or that a small group of wallets keeps leaning on the same level until the rest of the crowd gives up. That's why triple patterns deserve close wallet review, not just chart review.
As with the double pattern, confirmation is the break. Until then, the structure is only a test. Once support or resistance gives way, the move can accelerate because the repeated failure has already worn down participants on the wrong side.
Repeated tests mean more only when they come from different behavior, not just the same wallets hitting the same level.
Before acting, check for:
- Three distinct touches: the level should be obvious, not approximate.
- Volume contraction: each test often gets weaker.
- Wallet repetition: the same addresses testing a level again and again can point to distribution.
- Stop discipline: place the stop just beyond the level, because false breaks are common.
Triple tops and bottoms are useful because they show persistence. On Solana, that persistence can belong to a crowd or to a coordinated cluster. The chart looks the same either way, which is exactly why the on-chain evidence matters.
Top 10 Trading Patterns Compared
| Pattern | Implementation complexity 🔄 | Resource requirements | Expected outcomes 📊⭐ | Ideal use cases 💡 | Key advantages ⭐ |
|---|---|---|---|---|---|
| Head and Shoulders (and Inverse) | Medium, 🔄🔄, needs neckline & swing identification | Daily/4H closes, volume confirmation, liquidity & holder checks | Reversal signal; target = head‑to‑neck distance; reliability: ⭐⭐⭐ | Spotting distribution after a pump; swing trades on 4H–daily | Clear entry/stop/target rules; widely recognized |
| Double Top / Double Bottom | Low–Medium, 🔄🔄, horizontal level with tolerance rules | Volume profile, tolerance band (e.g., 2–3%), liquidity and wallet analysis | Reversal; target = peak‑to‑trough projected; reliability: ⭐⭐⭐ | Simple swing trades, range failures across timeframes | Easy to ID, tight risk placement |
| Triangles (Ascending / Descending / Symmetrical) | Medium, 🔄🔄, trendline touches required | Converging trendlines, volume contraction then expansion, liquidity depth | Continuation or neutral until breakout; target = triangle height; reliability: ⭐⭐⭐ | Trend continuation setups, entries on confirmed breakouts | Defined compression, good risk definition |
| Bull Flag / Bear Flag | Low, 🔄, short counter‑trend channel after strong pole | Strong high‑volume pole, declining volume in flag, quick liquidity checks | Fast continuation; target = flagpole length; reliability: ⭐⭐⭐ | Momentum scalps and quick entries after impulsive moves | Clear entries/stops and simple target math |
| Pennant | Low–Medium, 🔄🔄, compact triangle after impulse | Strong pole, quick volume contraction and return, close monitoring of liquidity | Short‑term continuation; quick resolution; reliability: ⭐⭐⭐ | Intraday/short trades and scalps on momentum moves | Tight stops, compact structure for fast trades |
| Rising Wedge / Falling Wedge | Medium, 🔄🔄, converging same‑direction trendlines | Multiple swing touches, volume divergence, holder/volume checks | Often reversal (or late continuation); target = widest part projected; reliability: ⭐⭐ | Spotting momentum exhaustion near tops/bottoms | Reveals waning momentum and possible reversals |
| Cup and Handle | High, 🔄🔄🔄, long rounded base plus handle | Long timeframe (weeks+), steady volume patterns, broad holder growth | Bullish continuation; high‑quality when valid; target = cup depth; reliability: ⭐⭐⭐⭐ | Longer‑term trend resumes on established tokens | Methodical rules (O'Neil), lower‑risk entries from handle |
| Rectangle (Trading Range) | Low, 🔄, horizontal support/resistance | Multiple touches on both boundaries, volume breakout confirmation, liquidity at edges | Continuation or reversal depending on breakout; target = range height; reliability: ⭐⭐⭐ | Range trading, mean‑reversion, breakout setups | Simple boundaries, natural stop placement |
| Rounding Bottom (Saucer) | High, 🔄🔄🔄, smooth long‑term arc | Weekly/monthly data, gradual volume curve, broad accumulation evidence | Durable bullish reversal; slow formation; target = prior high break; reliability: ⭐⭐⭐⭐ | Long‑term accumulation and position trades | Signals sustainable sentiment shift with less whipsaw |
| Triple Top / Triple Bottom | Medium, 🔄🔄, requires three clear touches | Repeated tests, declining volume checks, liquidity and wallet analysis | Strong reversal when confirmed; target = pattern height; reliability: ⭐⭐⭐ | Confirmed level‑break trades where level is well‑tested | Reinforced key level, clear risk management |
Pair Every Pattern With On-Chain Evidence Before You Trade
The safest way to read the most common trading patterns on Solana meme coins is to treat the chart as a hypothesis and the chain as the test. A close above resistance or below support matters, but it means less if the token has shallow liquidity, concentrated holders, or bundle-heavy activity. Price shape tells you what happened. Holder distribution, liquidity depth, and wallet behavior tell you whether the move was broad, fragile, or likely to fail.
That distinction is the whole point of using on-chain analytics with charting. A clean flag or triangle can still be a trap if a few wallets control supply, if liquidity thins out at the edges, or if the breakout is built on suspicious volume. Wash trading can distort reported activity, and classic momentum can reverse when the market runs out of follow-through, so pattern confirmation needs more than a line drawing (wash-trading evidence, momentum research).
A useful workflow is simple. First, confirm the price structure on a close. Then check whether the holder base is broadening or narrowing, whether liquidity can support the move, and whether bundle or insider-style activity is present. If those checks conflict with the chart, trust the conflict. The shape may still be real, but the trade can still be poor.
That's where a tool like MemeAssist fits naturally. Its reports surface a Rug Risk Rating and a Detailed Risk Breakdown alongside live on-chain and market checks, so the chart gets interpreted in the context that matters. The point isn't to find a pattern and declare victory. The point is to prove the move is tradable before capital goes in.
If you want to check a Solana token before acting on a chart, run it through MemeAssist and compare the price pattern with holder concentration, liquidity depth, and bundle signals. Use the report to separate a real setup from a shape that only looks tradable. Then decide whether the chart still makes sense once the on-chain evidence is in front of you.