Price Impact Crypto Explained: Formula, Slippage and Solana
Learn what price impact crypto really means, how AMMs and order books move execution price, and how to measure and minimize it on Solana meme-coin trades.
Published
Updated
A Solana meme coin catches your eye. The quote looks fine, you hit swap, and the confirmed amount comes back lower than expected. Nothing in the wider market seems to have moved, so where did the difference go?
Price impact is the change in expected execution price caused by your own order size relative to available liquidity, before fees and later market moves. Your trade itself can consume the pool's available liquidity and shift the price against you mid-fill.
Crypto prices also swing sharply for reasons that have nothing to do with your order, as noted earlier. Separating those two things matters especially in meme coins, where a pool can look deep enough on screen until a real order reaches it and the quote slips away.
Table of Contents
- What Price Impact Means in Crypto
- How Price Impact Is Calculated on AMMs and Order Books
- Price Impact vs Slippage Fees and Minimum Received
- What Drives Price Impact in Solana Meme Coins
- Worked Examples From Small Swaps to Pump.fun Style Buys
- How to Measure and Minimize Price Impact Before You Trade
- A Pre-Trade Checklist for Lower Price Impact
What Price Impact Means in Crypto
Price impact is the part of a worse fill caused by your order consuming available liquidity. It isn't the same as a market decline caused by news, momentum, or someone else selling after you trade. A boat barely moves the water around it; a large ship changes the waterline as it enters. In a trading pool, your order can similarly move the price as it uses up one asset and adds another.
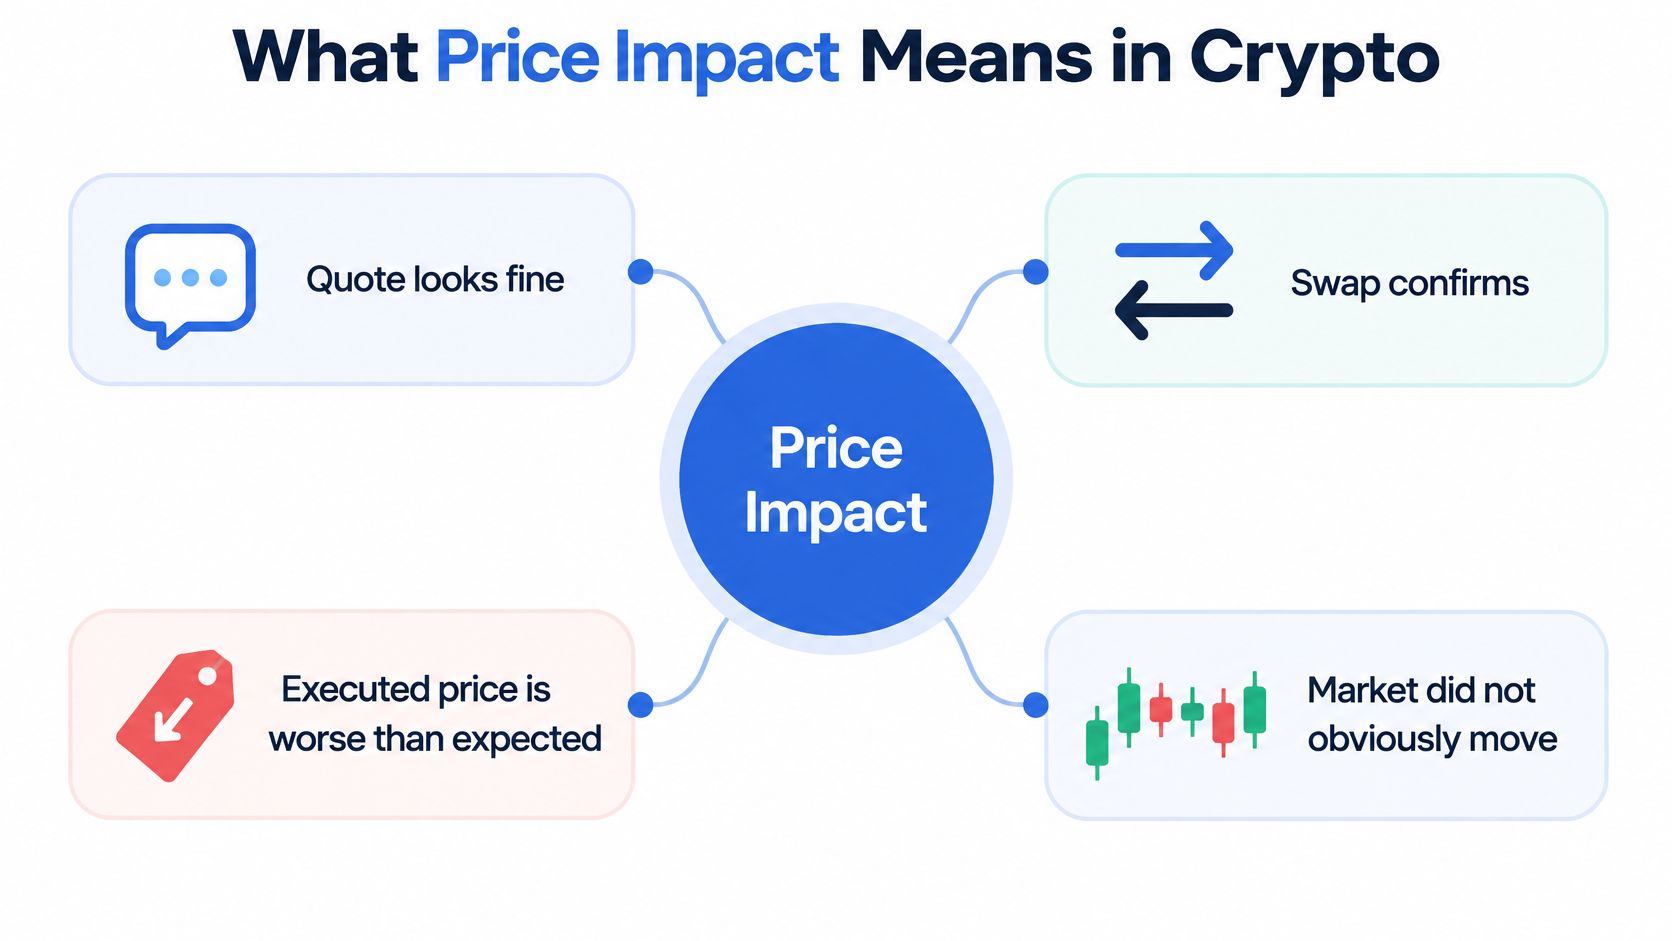
The impact is measured by comparing the expected execution price with the price implied by the pool or order book before your order. A small order against deep liquidity may barely change that price. A larger order against shallow liquidity can consume more of the available supply, so its average fill is worse than the starting quote.
This happens in both automated market makers (AMMs) and order books, though the mechanics differ. AMMs calculate prices from pool balances and a curve; order books match your order against available offers at successive prices. In either case, the top quote alone doesn't tell you how the full order will execute.
Practical rule: High impact tells you that your order may move the market against itself. It doesn't prove the token is strong, weak, safe, or unsafe.
How Price Impact Is Calculated on AMMs and Order Books
An AMM sets prices using the assets available in its pool. In a constant-product pool, the reserves of the two assets multiply to a constant: as a buyer takes tokens out and adds the quote asset, the pool's balance shifts and the marginal price moves along the curve. The larger the input compared with the reserves, the farther along that curve the trade travels.
A simple AMM example
Suppose a hypothetical pool holds 1,000 tokens and 10 SOL. Ignoring fees, the starting ratio is 0.01 SOL per token. A buyer who adds 1 SOL doesn't receive 100 tokens at that initial price, because each token removed makes the remaining tokens scarcer relative to SOL.
For a constant-product pool, the rough output calculation is:
Token output = token reserve × SOL input ÷ (SOL reserve + SOL input)
Using those hypothetical reserves, a 1 SOL purchase returns about 90.9 tokens before fees. The average price paid is therefore about 0.011 SOL per token, higher than the initial ratio. That difference is the mechanical effect of the order on the curve, not a prediction of what the token will trade at later.
Order books work differently
An order book lists buyers and sellers at different prices. If your buy is larger than the tokens offered at the best ask, it consumes that level and fills against the next, more expensive offers. The average fill depends on the amount available at each price tier, not just the best displayed quote.
For example, suppose sellers offer 100 tokens at 1 SOL each, then another 100 at 1.1 SOL each. A market buy for 150 tokens would pay 100 SOL for the first group and 55 SOL for the second, or 155 SOL total. Its average is about 1.033 SOL per token, even though the best ask was 1 SOL.
Pool depth at the relevant price, route quality, fee tier, volatility, and liquidity beyond the top quote all affect what a trader receives. A headline liquidity figure can hide thin depth just beyond the displayed price or liquidity concentrated in a narrow range. For execution decisions, inspect the quote for your actual order size rather than relying on the opening price alone.
Price Impact vs Slippage Fees and Minimum Received
Traders often use price impact, slippage, fees, and minimum received as if they describe the same cost. They don't. Separating them helps pinpoint whether a poor result came from your order size, changing market conditions, or trading costs.
| Term | What It Measures | When It Appears | Main Control |
|---|---|---|---|
| Price impact | The price change caused by your order consuming liquidity | The quoted average fill worsens as order size rises | Reduce order size, choose a deeper route |
| Slippage | The difference between the expected and final execution | The transaction fills at a different price than the quote | Review slippage tolerance and market conditions |
| Fees | Costs charged by the network, protocol, or route | The output is reduced by transaction or swap charges | Compare route and fee details |
| Minimum received | The lowest output you'll accept before the swap reverts | The transaction is submitted with a slippage tolerance | Set a tolerance that fits the token's volatility |
A quote can show impact before submission, while slippage describes how the final execution differs from what you expected. Slippage can reflect market movement while a transaction is pending, routing changes, and fees, as well as the trade's own liquidity effect. Read the interface carefully: some platforms report price impact before fees, while others surface an estimated total cost or output after fees.
Fees reduce what you receive but aren't themselves price impact. Minimum received is a guardrail, not a prediction. If the actual output falls below that floor, the swap should fail rather than execute at an even worse price, though the network may still charge a transaction fee.
If the quote gets worse as you increase the order, suspect impact. If the quote was acceptable but the fill changes after submission, suspect slippage. If the output is simply lower, check the route and fees too.
What Drives Price Impact in Solana Meme Coins
A 5 SOL buy can be routine in one meme-coin pool and chaotic in another. The main driver is order size relative to usable depth near the current price; headline pool value can mislead. In a constant-product AMM, impact grows as the trade pushes reserves farther from their starting ratio. In concentrated liquidity, depth can look solid until the order crosses out of the active range and finds thin inventory.
Depth also has a durability problem. LPs can pull liquidity, early holders can sell into strength, and creator-linked wallets can add supply while buyers are still entering. A pool that looks deep at quote time may be weaker by the time a later sell needs an exit. A practical guide to minimum liquidity for Solana meme coins helps separate displayed size from liquidity that is likely to stay.
Launch mechanics and market conditions
Bonding-curve launches add a mechanical driver: each buy moves the next buyer's price upward along the curve. Hype can make volume look broad while the order book still depends on the same small set of holders and the same narrow exit path. Better routing or a lower fee tier can reduce cost around the edges, but neither repairs a fragile market.
Regime matters when you read a quote. As noted earlier, crypto markets can flip from calm to disorderly fast, so the same percentage impact can mean different things in a quiet session and during a cascade. Treat a high quote as evidence to investigate, not as a standalone verdict. Compare impact at several sizes with wallet concentration, creator-linked transfers, buy-sell imbalance, and whether liquidity remains after the trade.
Low impact still does not certify safety. It only says the mechanical part of that order looks contained under current conditions.
Worked Examples From Small Swaps to Pump.fun Style Buys
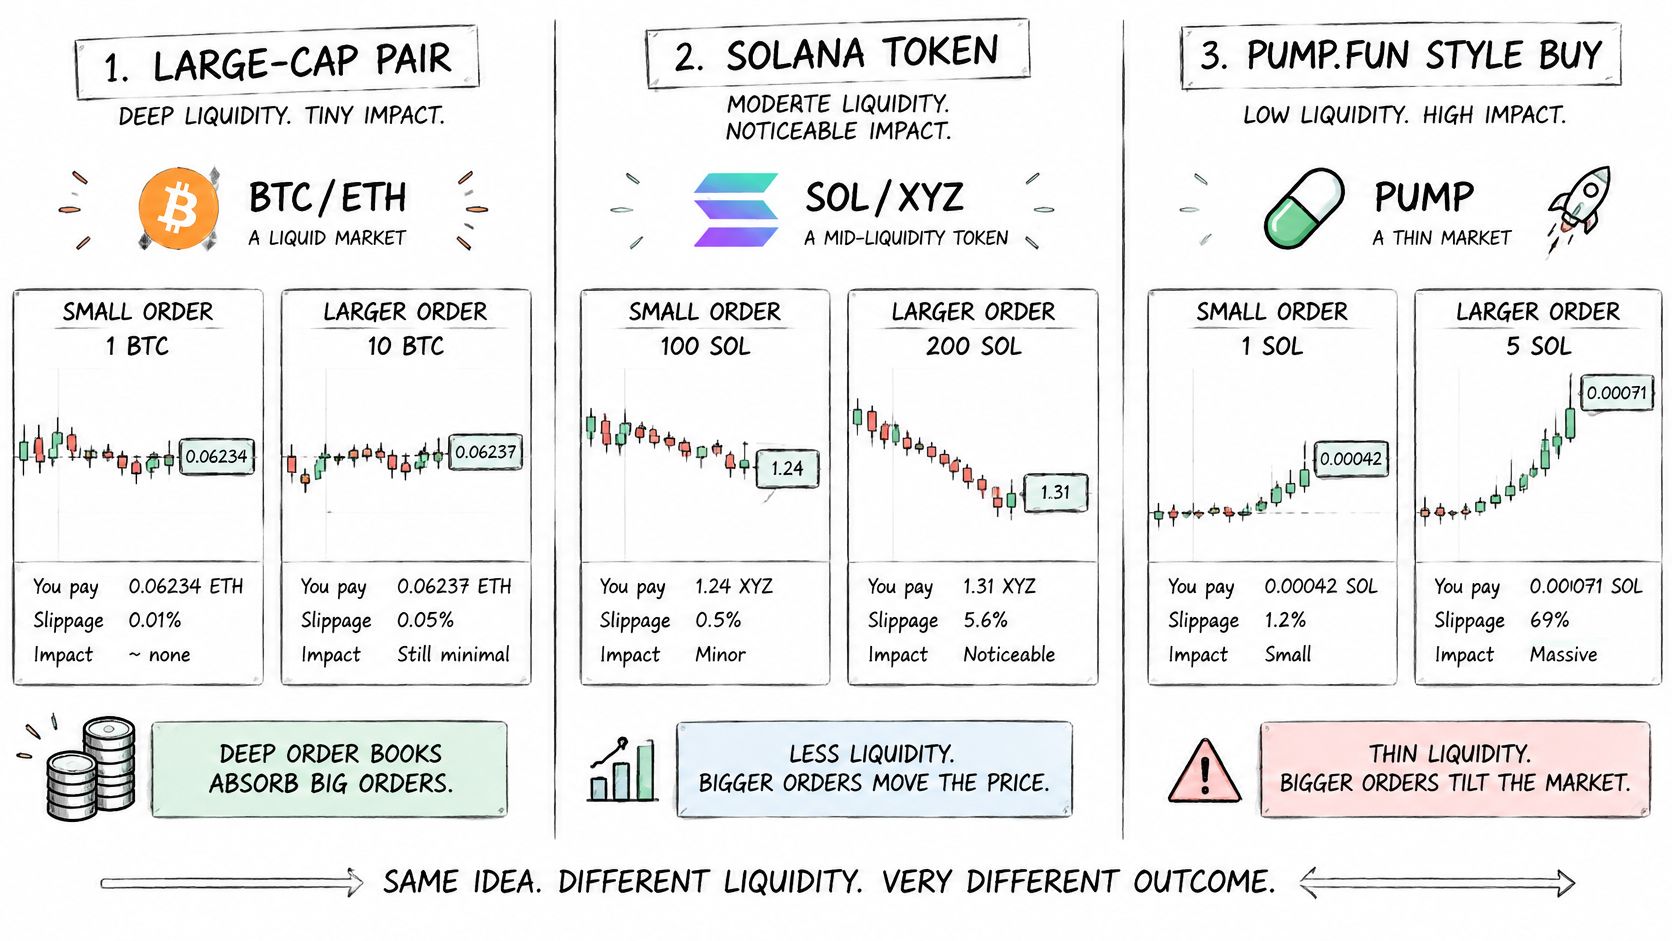
The examples below are hypothetical, worked from simple reserve assumptions rather than live quotes. They show how the same 1 SOL order can cost almost nothing in one pool and lose a meaningful share of its value in another, before fees or slippage enter the picture.
A small buy in a deeper pool
Suppose a pool holds 100,000 tokens against 1,000 SOL, giving a starting ratio of 0.01 SOL per token. A trader buys with 1 SOL. Under the constant-product formula, the pool's SOL side rises to 1,001, and the token side falls to keep the product constant, returning about 99.9 tokens to the buyer.
The average price paid works out to roughly 0.01001 SOL per token. That is about 0.1% above the starting ratio, a small mechanical cost. Two things stay true at the same time: the trade itself was cheap, and that cheapness says nothing about whether the token is safe or whether the liquidity will still be there when the trader wants out.
A larger buy in a thinner pool
Now take a pool with 1,000 tokens against 10 SOL. Same starting ratio, same 1 SOL order. The constant-product calculation returns about 90.9 tokens before fees, an average price near 0.011 SOL per token. The mechanical impact is now around 10%, a hundred times larger than in the deeper pool, because the order consumes a tenth of the pool's SOL reserve instead of a thousandth.
The curve is also nonlinear. Doubling the order more than doubles the impact, because each additional unit of SOL moves the reserve ratio further against the buyer. A quote preview at your intended size, checked alongside smaller and larger test sizes, reveals how steeply that deterioration accelerates.
One more distinction matters here. The impact calculated above is the mechanical cost built into the curve. It arrives before trading fees, before any price drift between quoting and execution, and before the separate question of whether the trade can be unwound later.
A bonding-curve launch
Bonding-curve launches add a different mechanism. Each purchase moves the next buyer's entry price upward by design, so a late buyer watching the quote climb can mistake programmed price appreciation for organic demand. The rising curve is a property of the contract, not evidence that independent buyers with real size are waiting behind you.
The practical test is what happens after execution. High impact in a naturally small pool warns about exit difficulty. High impact followed by liquidity withdrawal, creator-linked transfers, or steady insider selling suggests supply is being distributed into each new wave of buyers. Read the mechanics and pitfalls of Pump.fun bonding-curve trading risks before treating a rising quote as an invitation to chase.
How to Measure and Minimize Price Impact Before You Trade
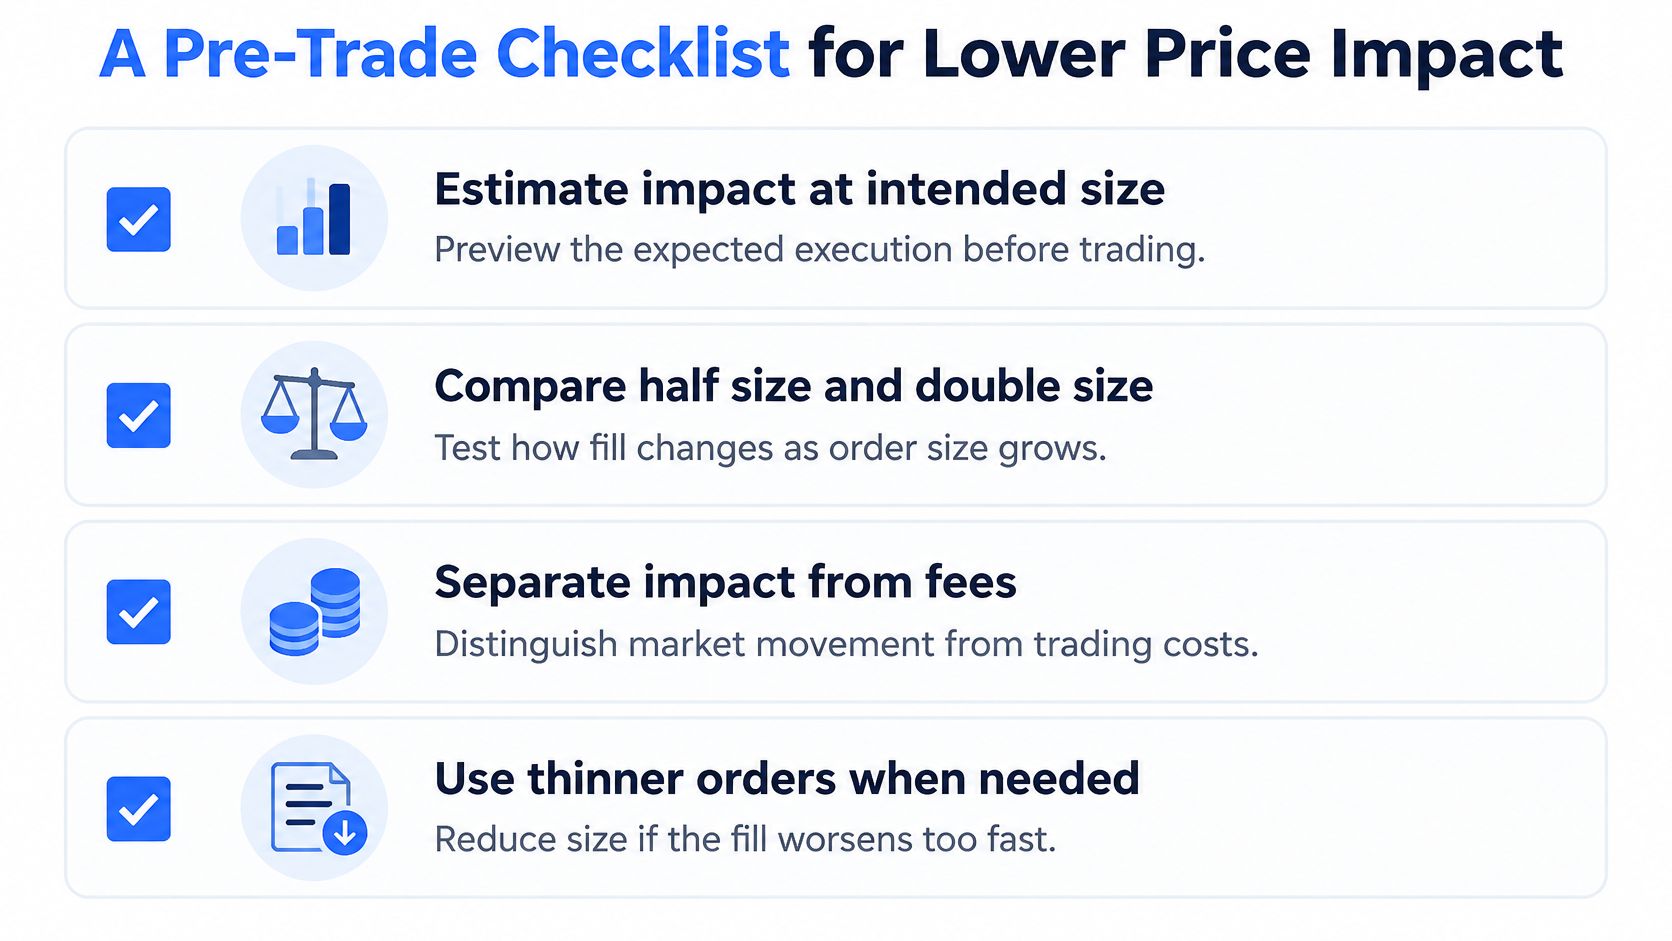
A quote only means something at the size you intend to trade. Pull the preview for your order and record the expected execution price, quoted impact before fees, estimated total cost, minimum received, and route. Then run the same preview at half and at double that size. If the average price slips slowly, the pool is absorbing you. If it worsens sharply, shrink the order or walk away, because the curve is telling you the depth.
Use more than one view
Each tool shows a different slice of the same trade. A DEX preview describes one execution path. An aggregator searches across pools and may split your order among several of them. A limit order, where supported, caps your entry price at the risk of never filling. Manual pool inspection adds what none of these screens show: whether depth sits near the current price or disappears a few ticks out.
For Solana meme coins, the quote also misses the manipulation layer. Holder concentration, recent pool changes, and creator-linked wallet flows shape whether the liquidity you measured will still exist when you sell. A Solana liquidity checker folds those pool conditions into a broader token-risk review alongside your swap quote.
Read the quote in its market context
As noted earlier, peer-reviewed research on Bitcoin found that variance jumps sharply around adverse events, and stressed markets behave nothing like calm ones. Apply that here. The same quoted impact means one thing on a quiet afternoon and something else during a sell-off, when prices can move while your transaction sits pending and forced selling drains the depth your quote assumed.
Each tool has one job.
The preview estimates execution. The aggregator hunts routes. Manual checks expose pool structure and wallet patterns. None of them, alone or together, proves a token is safe to hold or easy to sell.
A Pre-Trade Checklist for Lower Price Impact
A quote can look acceptable because it blends several different costs into one warning. Treat the checklist like a preflight routine: separate the pool's mechanical price move from fees, slippage tolerance, and signs that the liquidity may not be there when you sell.
- Quote your real size. Enter the exact SOL or token amount, since a tiny test buy can hide the curve your full order will climb.
- Step the size up and down. If impact rises slowly, depth may be usable; if it jumps after a small increase, the near-price layer is thin.
- Label each cost. Pool impact belongs to the AMM math; fees belong to the route and network; slippage belongs to movement while the transaction waits.
- Read depth near the mid price. Total liquidity can sit far away or in a range position that does not help your fill.
- Test durability as well as depth. Check concentration, recent pool changes, and creator or connected-wallet selling, as noted earlier.
- Respect bonding-curve traps. On pump.fun style launches, a higher buy price can be the mechanism working, while exit liquidity remains untested.
- Split only with a reason. Compare total fees and the risk that later tranches execute after the price moves.
- Reprice under stress. In volatile periods, widen the margin for error or stand down.
Run the address through a live token-risk report before your next Solana meme-coin buy, then let the findings set size, timing, and whether to trade at all. The aim is boring execution: know what the pool will do mechanically, know what can move while you wait, and know whether the exit looks real.