Pump and Dump Crypto: Warning Signs and How to Spot Them
Pump and Dump Crypto explained: the volume, wallet and liquidity signs to check, plus trading rules that cap your losses before you buy.
Published
Updated
A meme coin starts climbing while you're watching the chart. The candles are steep, the volume is suddenly loud, and a Telegram call or influencer post gives you a reason to buy before the move is over. The difficult question isn't whether the price rose. It's whether real buyers are driving the move, or whether someone is creating demand to sell into it.
Table of Contents
- What Pump and Dump Crypto Means
- Warning Signs to Check Before You Buy
- Telling Momentum From an Orchestrated Pump
- How Detection Models Catch Pumps Early
- A Worked Example From Accumulation to Exit
- Protective Rules for Trading a Suspected Pump
- Decide Before You Buy, Not After the Chart Moves
What Pump and Dump Crypto Means
A pump and dump resembles a stage-managed auction. Insiders buy cheap lots, hype the item, then sell to late bidders as the price peaks.
In crypto, a pump and dump is a coordinated plan in which insiders accumulate a token, promote it through Telegram, Discord, X, or influencer posts, and sell into the demand they've helped create. The token's price can rise sharply while new buyers mistake coordinated activity for broad interest.
A 2023 study of 355 manipulation cases across a six-month sample found average price distortions of approximately 65% and abnormal trading volume of about 13.5 times normal. The researchers estimated that roughly 15% of 1,307 coins, or 197 assets, experienced at least one pump-and-dump event, with an average of 1.8 pumps per affected coin (the 2023 study of cryptocurrency pump-and-dump schemes). Those figures don't mean every fast rise is manipulated. They do show why price and volume need to be read together.
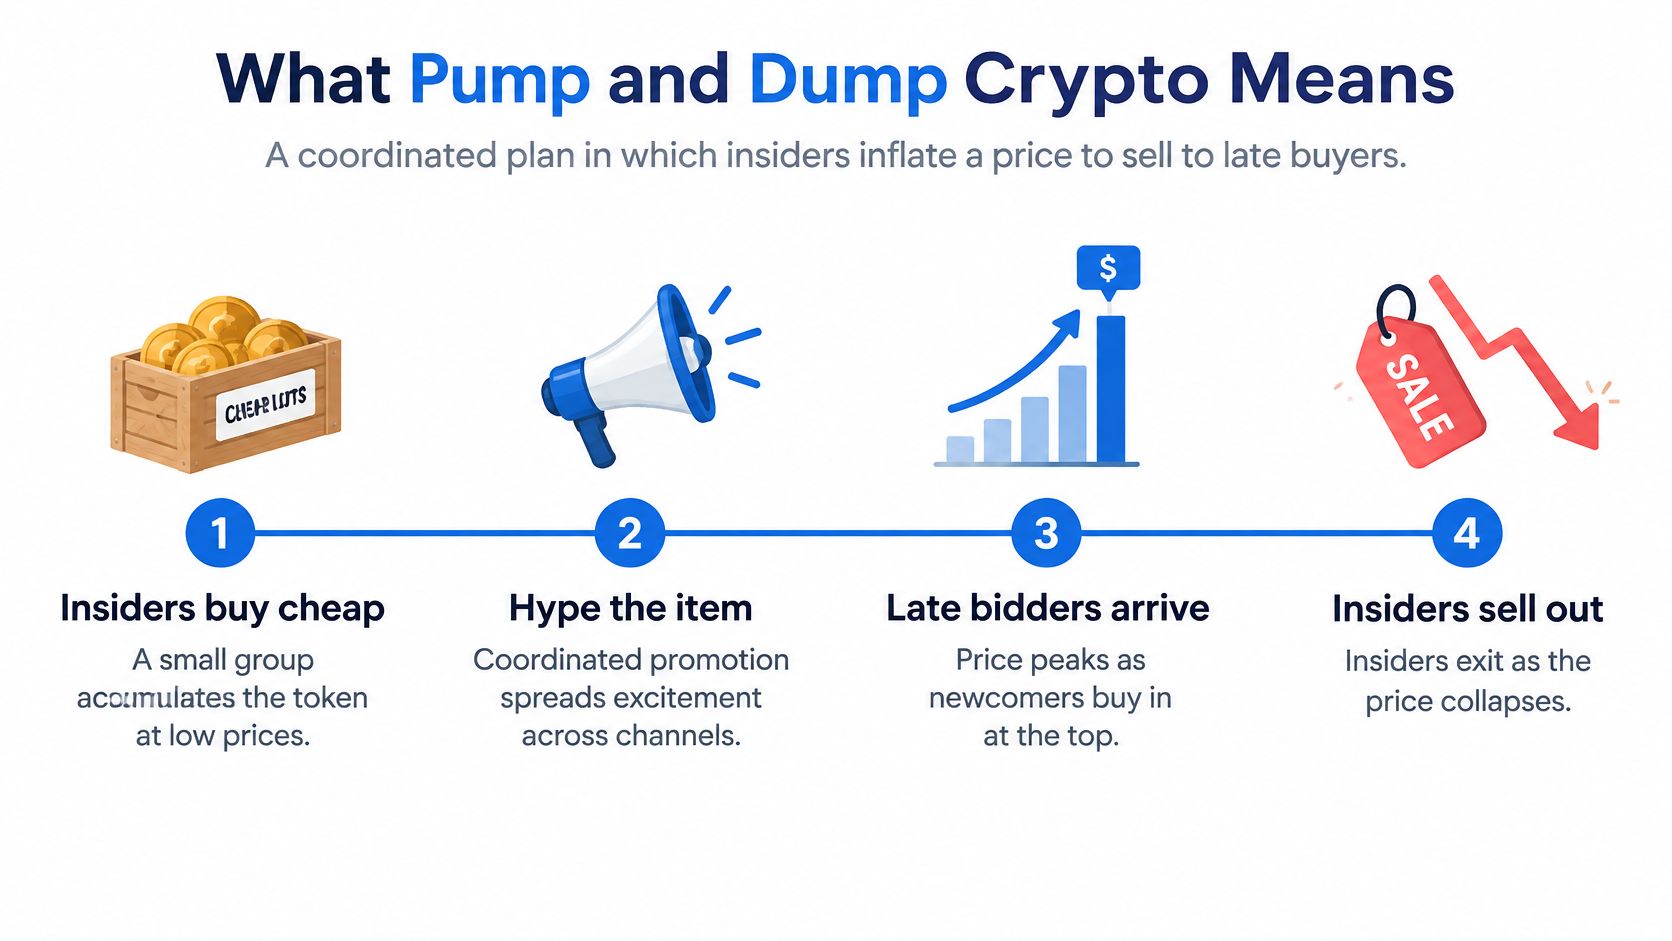
The four phases of a scheme
A typical sequence has four phases. Timing can vary, but the order is useful: quiet buying may begin before the first public call, and selling can start while new buyers are still arriving.
| Phase | What Insiders Do | Market Signature | Typical Timing |
|---|---|---|---|
| Accumulation | Buy quietly in small orders, often from new wallets | Flat or slowly rising price, with volume growing and no news | Hours to days before promotion |
| Promotion | Post coordinated calls in channels and influencer feeds | Volume jumps above baseline and price climbs quickly | Minutes to a few hours |
| Distribution | Sell into buying from new participants | Price stalls near the peak, sell orders grow, and volume stays high | Minutes to a few hours |
| Collapse | Remaining holders exit as liquidity thins | Sharp price fall, falling liquidity, and buying that dries up | Often within 24 hours |
The key distinction from an ordinary rally is intent. A rally can be speculative and volatile without being orchestrated. A pump is designed around a planned exit, but a fast rise alone isn't proof of manipulation.
Warning Signs to Check Before You Buy
Small, illiquid tokens are common targets because relatively modest coordinated buying can move their quoted prices, while later buyers may struggle to sell. A three-year study identified 902 pump-and-dump operations involving 378 cryptocurrencies. Among target assets with available volume data, 83.5% had traded less than $1 million in the 24 hours before the pump, and 53.5% had traded less than $10,000. Of the coins with market-cap data, 71% were valued below $20 million (the longitudinal study of coordinated crypto promotions). Low volume isn't proof of fraud, but it makes the market easier to move and harder to exit.
Use the signals below as a combined screen. Compare current activity with the token's own recent trading, and verify what you can on-chain rather than relying only on social posts.
| Signal | Normal Trading | Pump-Risk Reading | Where to Check |
|---|---|---|---|
| Volume versus recent average | Moves with news and daily cycles | Spikes many times the recent average with no clear news; the academic sample found abnormal volume near 13.5 times normal | Chart volume panel |
| One-day price move | Gradual moves with visible pullbacks | Near-vertical candles of 50% or more within hours | Price chart on one-hour candles |
| Top-holder concentration | Largest holders own a limited share of supply | A few wallets control a large share and could sell into demand | Token holder concentration and the holder list in a token scanner |
| Liquidity depth | Pool depth can absorb ordinary buys and sells | A thin pool means one large sell may sharply move the price | Pool-size view and sell-impact check |
| Early buying pattern | Buys arrive at different times from unrelated wallets | Newly funded wallets buy in a tight cluster before promotion | Wallet and transaction history |
| Promotion timing | Social posts follow visible trading interest | Volume rises before the first public call | Compare post timestamps with the volume chart |
| Creator-wallet activity | Creator-linked wallets aren't selling into the rise | Creator-linked wallets transfer or sell during the spike | Creator and transfer history |
No single row proves a scheme. A sudden price candle may reflect a genuine announcement; concentrated holders may be early supporters. Two or three risky readings together deserve more weight than one dramatic candle, especially when the signals describe different parts of the market, such as wallet activity, liquidity, and promotion timing.
Telling Momentum From an Orchestrated Pump
A price spike doesn't, by itself, prove manipulation. Meme coins can attract genuine speculative demand, and a real launch can still have sharp candles, excited posts, and concentrated ownership. The useful question is whether several clues align into a pattern of coordinated buying and an organized exit.
A 2025 study examined 20,688 meme coins across Solana, BSC, Ethereum, and Base. It identified 91 operations across 60 tokens, including 54 on Solana, using a combined pattern: price growth above 50%, volume above 500% of its starting level, a move completed within 24 hours, then a decline above 30% with a substantial volume collapse (the 2025 study of meme-coin pump-and-dump activity). Those criteria are a research method, not a universal rulebook. A token can meet one or two conditions without proving coordination.
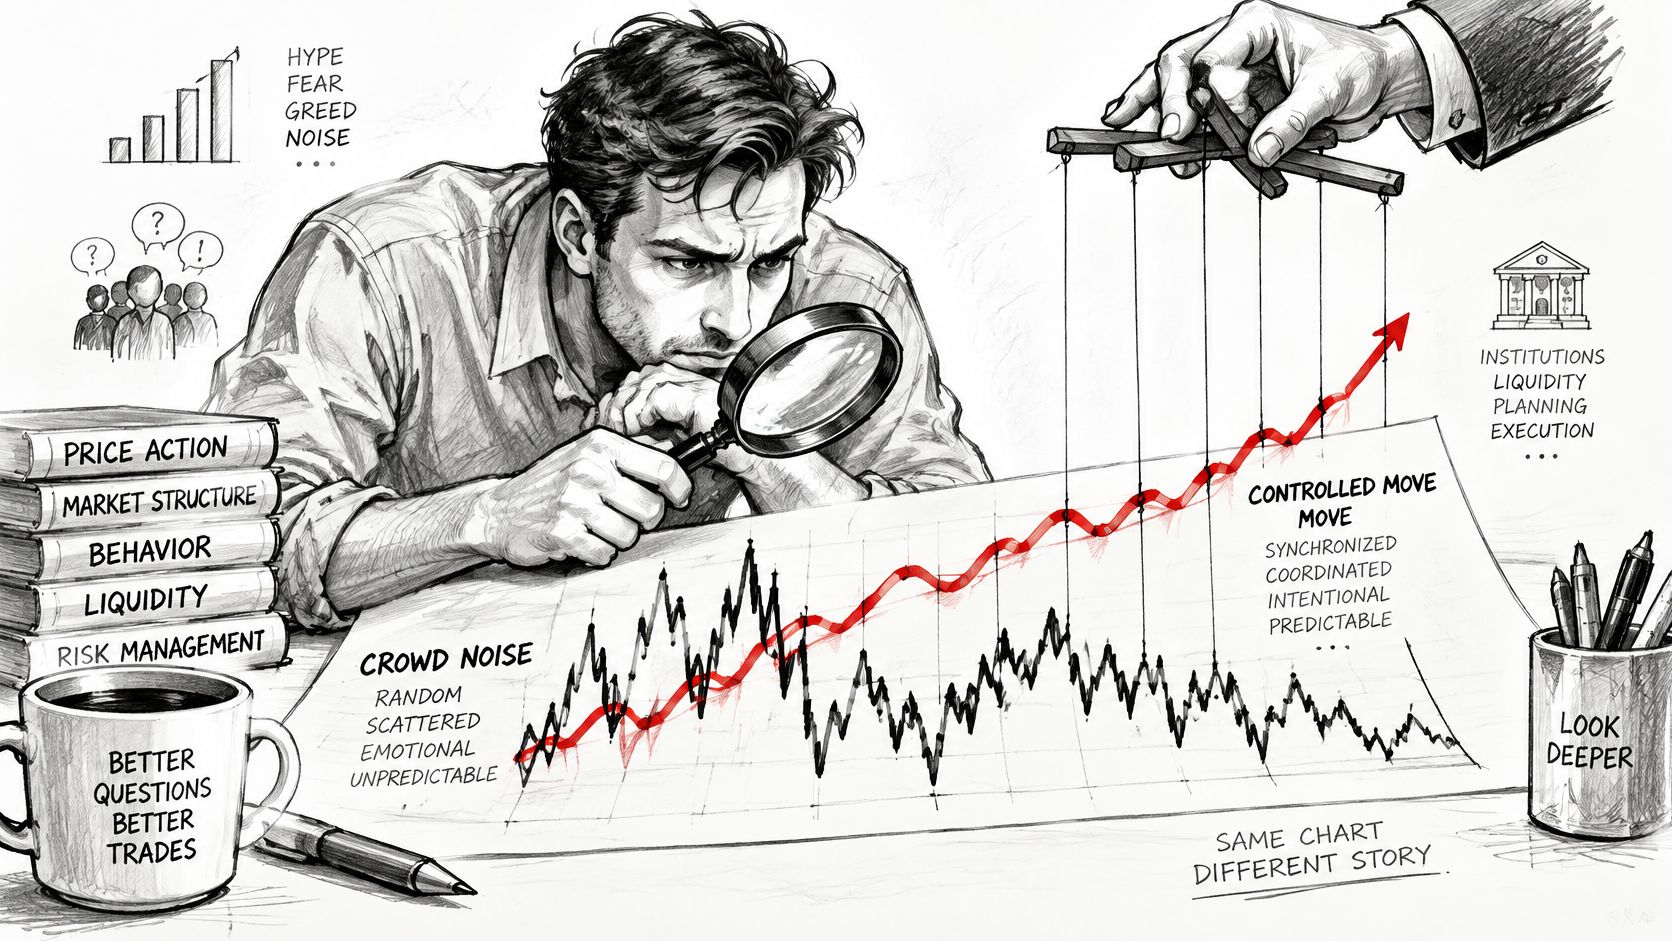
Four tests that separate a pattern from a spike
Timing: Check whether trading accelerated before the first public call. If wallets accumulate while volume climbs and promotion arrives later, the sequence is more concerning than social excitement that follows an already visible move.
Persistence: Watch what happens after the peak. In a sustained speculative move, buyers may continue to trade after the first burst of attention. If volume collapses as soon as the promotion fades, or liquidity thins while sellers arrive, late buyers may be left with a price that can't be realized at the chart quote.
Ownership concentration: Look at who holds the supply. A few large wallets don't automatically indicate a scheme, but concentrated ownership gives those holders more power to move the market when they sell. Related wallet activity and possible wash trading on Solana can add context.
Exit behaviour: Check creator-linked wallets and early buyers for transfers or sales during the rise. Selling into strength, especially alongside shrinking liquidity, is stronger evidence than a promotional post by itself.
Social hype is a clue, not a verdict. A pump is more likely when timing, volume persistence, concentrated ownership, and exit behaviour line up. A good risk assessment should show which signals support concern and where evidence is weak, rather than pretending a fast chart can produce a certain scam label.
The video below provides another visual reference for thinking about price moves and market manipulation.
How Detection Models Catch Pumps Early
Pump detection is a short-window anomaly problem. Coordinated activity compresses abnormal buying and selling into a brief period, so price, volume, volatility, and order-flow imbalance can rise together. Looking at one indicator in isolation can miss the pattern, while a daily snapshot can smooth over the sequence that matters.
A study of 351 pump signals found that a random-forest model performed best when trades were aggregated into 30-second intervals and predictors were calculated using a one-hour moving window. The authors also found that detection could begin up to 60 minutes before the public announcement (the study of crypto pump-signal detection). Those settings are findings from that study, not a guarantee that every token can be flagged in advance.
The practical principle is to compare activity with a rolling baseline. A token that normally trades with little fuss can show a meaningful anomaly at a lower absolute volume than a heavily traded coin. Review the change in volume and volatility together, then inspect liquidity and the wallets creating the trades.
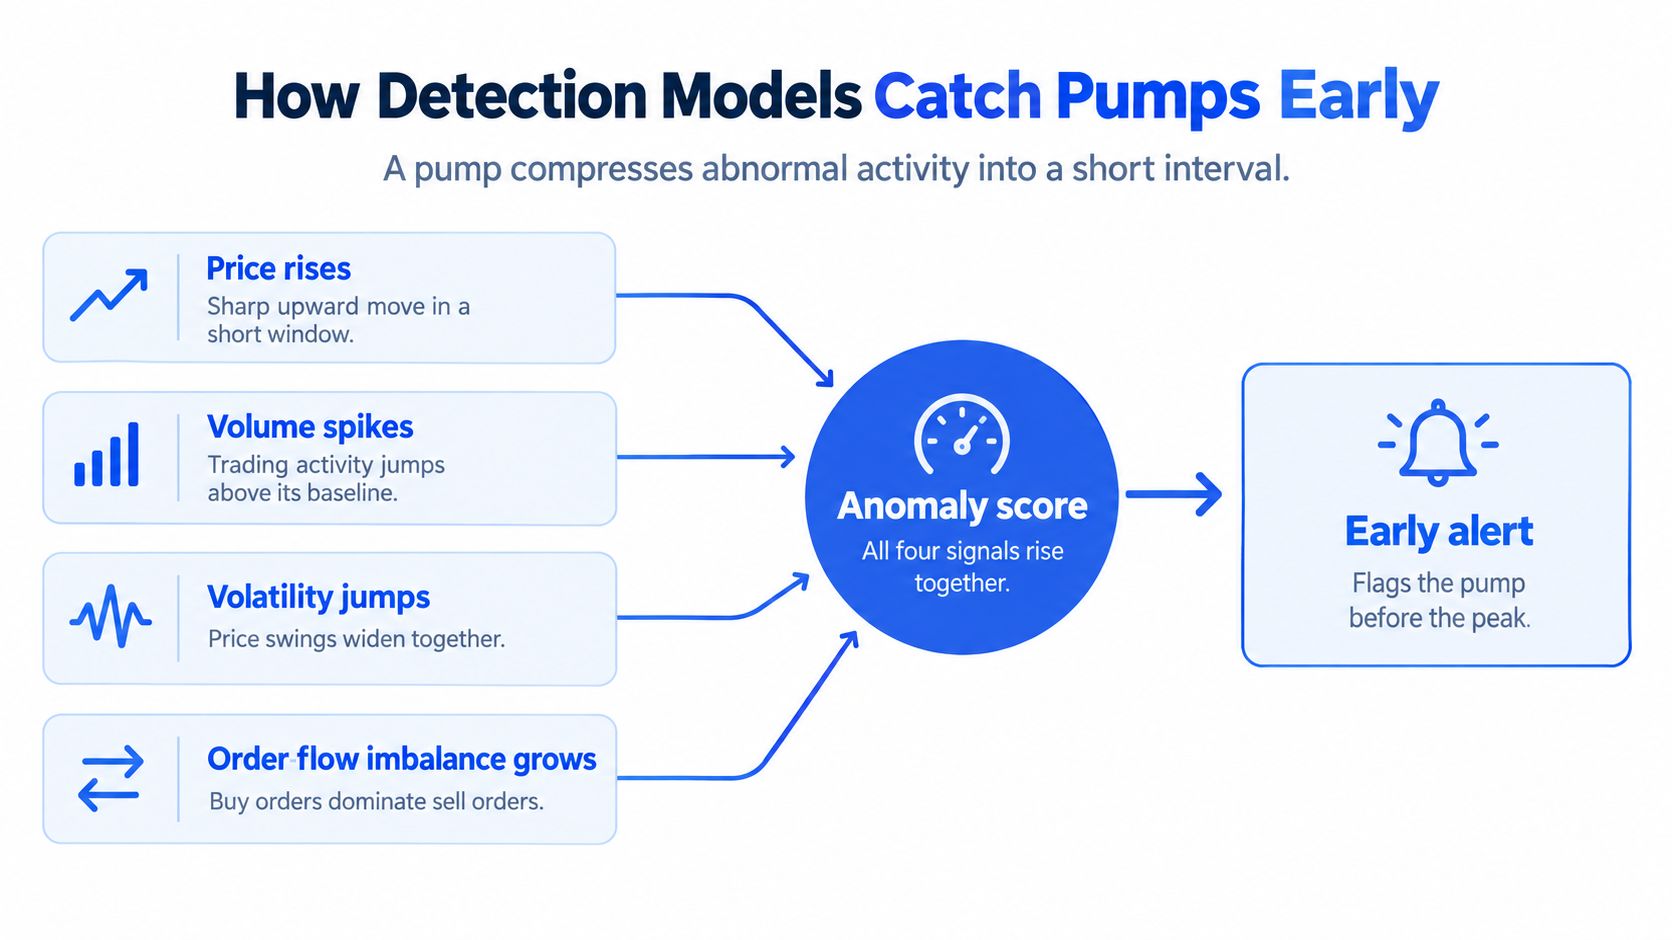
A practical detection pipeline
- Aggregate trades into short buckets. Short intervals make a burst visible before it disappears inside a daily total.
- Compute a rolling baseline. Compare current volume and volatility with the token's recent behaviour, not an arbitrary absolute threshold.
- Flag joint rises in price and volume. A price jump with ordinary volume tells a different story from a price jump paired with a sharp volume surge and one-sided buying.
- Recheck liquidity and sell-side depth. A pump-risk alert is more useful when it shows whether a trader can exit near the quoted price.
- Escalate to follow-up tracking. Preserve the observations that triggered the alert, then monitor whether wallets sell, activity persists, or liquidity disappears.
Models also need sensible calibration. When genuine pump events are rare compared with ordinary trades, a model optimized for overall accuracy can miss many of the events it is meant to catch. The study recommends setting the probability threshold near the event prevalence to balance sensitivity and specificity.
| Setting | Practical Use |
|---|---|
| Trade interval | 30-second aggregation was the best-performing setting in the study |
| Moving window | A one-hour window for calculating predictors performed best in the tested model |
| Baseline | Use rolling historical volume and volatility, not absolute volume alone |
| Alert review | Treat the score as a prompt to inspect liquidity, wallets, and sell-side conditions |
Daily snapshots can miss both quiet accumulation and a fast exit. By the time the end-of-day chart shows a collapse, the early buying pattern and the point at which liquidity began to fail may already be obscured.
A Worked Example From Accumulation to Exit
This is a hypothetical sequence, not a claim about a real token. The figures illustrate how signals can arrive in order, and why waiting for a public promotion may mean waiting too long.
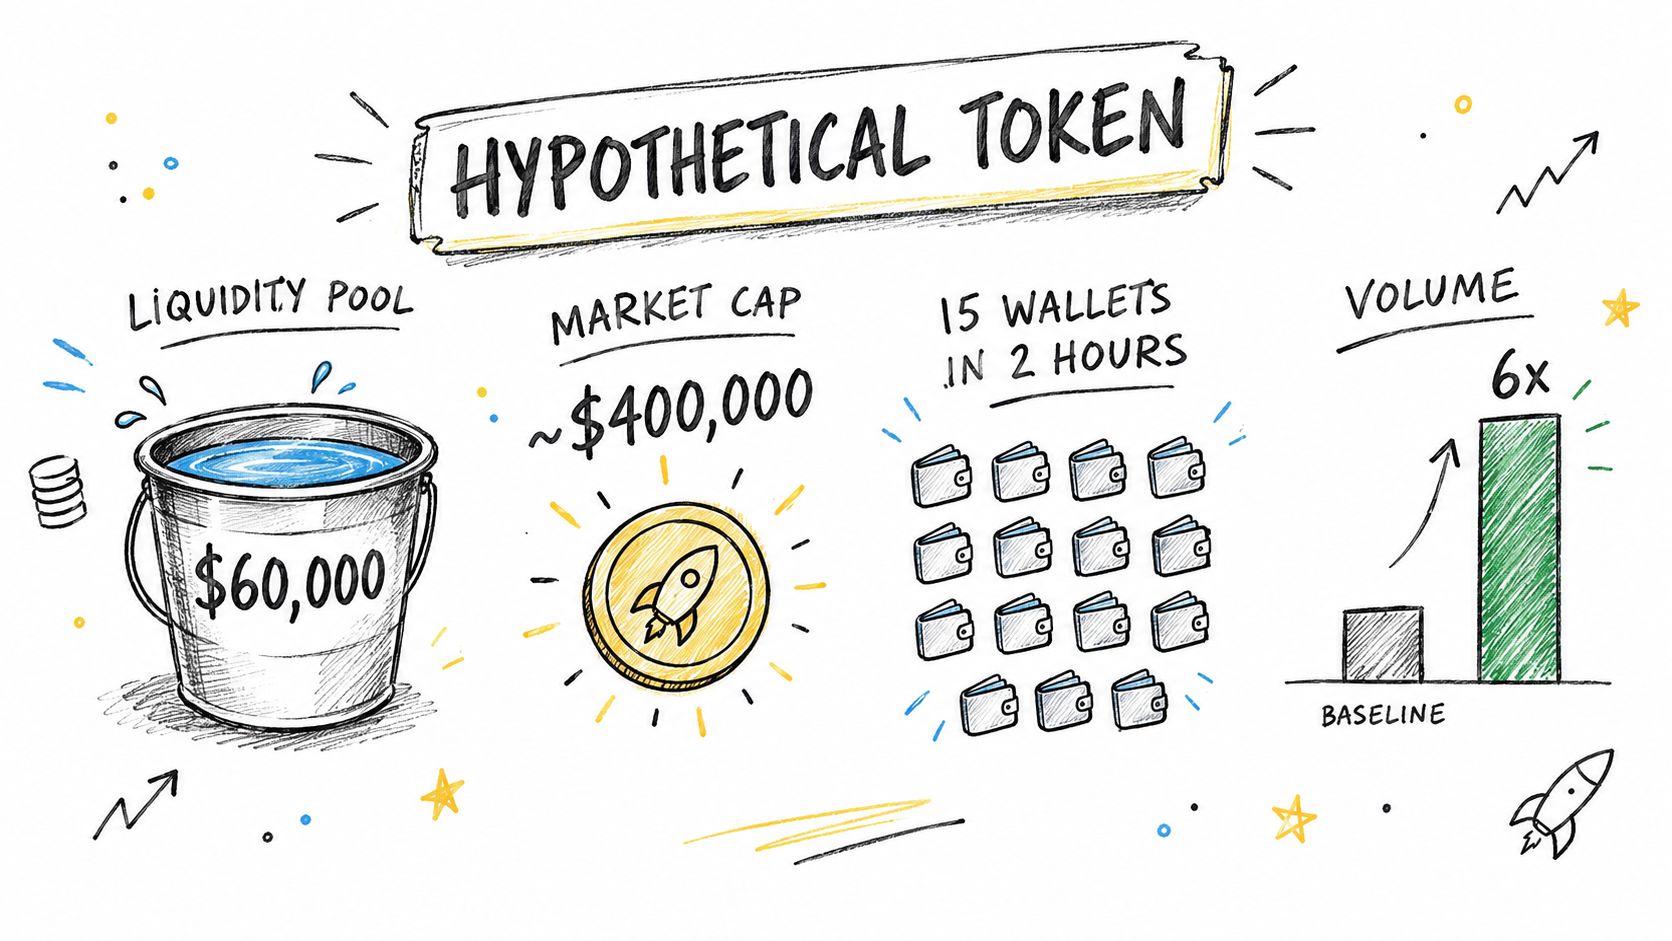
On day one, a token has a $60,000 liquidity pool and a market cap near $400,000. Fifteen fresh wallets buy across two hours, and volume reaches six times its previous baseline before anyone posts a call. That combination raises the early buying pattern and volume versus recent average signals. A cautious trader could pause here and inspect wallet funding, holder concentration, and whether the pool can handle a sale.
At 14:00, two channels and an influencer post a token call. Within 90 minutes, the price rises about 180%, while volume reaches roughly 14 times baseline. The promotion lines up with the spike, but the earliest warning was still the volume increase before the posts. A trader who waits for a social confirmation may be buying after the insiders' accumulation phase.
During the rise, insiders begin selling into new demand. The price stalls near its peak, the creator-wallet activity signal turns adverse, and pool liquidity falls from $60,000 to $9,000 within an hour. A trader checking only the price chart may see a brief pause; a trader checking the pool and wallet history sees that the ability to exit is deteriorating.
Within six hours, the price is down about 75%, and late buyers can't exit without heavy slippage. The practical action point wasn't a perfect prediction of the collapse. It was the first combination of unexplained volume and synchronized early buying, followed by confirmation from promotion timing, selling, and falling liquidity.
The sequence can recur across tokens, but the numbers will differ. Use the example to understand the order of signals, not as a set of exact thresholds to trade mechanically.
Protective Rules for Trading a Suspected Pump
Run these checks before every entry:
- Size for a total loss. Choose a position you can afford to lose completely.
- Set the exit before buying. Decide what price, liquidity change, or wallet behaviour will make you leave.
- Don't chase a near-vertical move. A rise of 50% or more within hours is a reason to investigate, not an invitation to market-buy.
- Confirm the sell route. Check pool depth and estimated sell impact before you enter.
- Watch liquidity, not just price. A chart can show a tradable price even as the pool becomes too shallow for your position.
- Don't average down into a collapse. Lower prices don't restore liquidity or prove that the original demand is returning.
These rules matter most after a warning, when a token may remain technically tradable but become difficult to exit. A report covering more than 7 million Pump.fun tokens launched from January 2024 through March 2025 found that 98.6% showed indicators of fraudulent activity, while fewer than 100,000 retained liquidity above $1,000. Among 388,000 Raydium pools, 93% reportedly showed “soft rug pull” patterns, with median losses of $2,832 (the report on Pump.fun tokens and Raydium pools). Treat these figures cautiously: the report's definitions and methodology shape its headline rates, so they aren't exact odds for an individual token.
A warning doesn't tell you the collapse is over. Track whether suspected wallets sell, whether the pool shrinks, and whether buyers return with enough depth to support an exit. For a position already open, decide whether you're following a fixed exit or a take-profit versus trailing-stop approach before panic replaces the plan.
Position rule: If a total loss would change your finances, the position is too large.
MemeAssist's own dated reports also illustrate why a warning should lead to action rather than reassurance. The token dog was flagged when one wallet held 79% of supply on 29 July 2026, and its price changed −69.3% over the following 24 hours. Tokens flagged high rug risk had an average price change of −45.3% over 24 hours, based on 1,320 tokens analysed from 2026-08-03 to 2026-10-22. Those outcomes describe the reported cases, not a forecast for any token you hold.
Even a token that passes a risk screen can collapse if demand disappears, large holders sell, liquidity changes, or new information appears. Checks can reduce risk, but they can't remove it.
Decide Before You Buy, Not After the Chart Moves
The decision belongs before the buy, not after a fast candle has made you feel committed. Use the number and combination of warning signs to choose an action, rather than treating a single signal as a verdict.
| Signals Present | Likely Reading | Action |
|---|---|---|
| None of the warning signals | Low pump risk, not zero risk | Size normally and keep a pre-set exit |
| One isolated signal, such as a volume spike with no news | Unclear, could be organic | Wait for a second signal or a pullback |
| Two or three signals, such as thin liquidity and concentrated holders | Elevated pump risk | Skip, or use a small position with a stop |
| Four or more, including synchronized buys and creator selling | High pump risk, exit may be engineered | Don't enter; cut any existing position |
For a second perspective, MemeAssist is an AI-powered Solana token risk analysis tool that evaluates live on-chain signals across liquidity, holder distribution, creator behaviour, wallet activity, trading patterns, and historical risk indicators. Its reports provide a health score, rug risk rating, AI verdict, and detailed risk breakdown, but an automated analysis is informational, not financial advice.
Meme coins are extremely risky, and users can lose all the money they invest, even without a rug pull. Treat any analysis as evidence to weigh alongside your own exit plan, not a guarantee that a token is safe.
Run a pre-trade check before you buy into a suspected pump. MemeAssist analyzes live Solana token signals and explains risks such as thin liquidity, concentrated holders, and suspicious wallet activity. Use its report as a second perspective, then make your decision with a position size and exit plan you can live with.