10 Risk Indicators Examples for Solana Meme Coins (2026)
Explore 10 Risk Indicators Examples for Solana meme coins, from holder concentration and liquidity locks to wash trading and creator sells, with clear checks.
Published
Updated
A clean holder list can still hide the rug. A token can look diversified on the surface while a few linked wallets, a fragile pool, or a fast-changing launch pattern control the outcome. That's why risk indicators examples work better as a sequence than as a single score. Each check measures one part of the trade, each one can fail, and each one needs a second check before you buy.
Solana meme coins punish lazy reading. A token might have broad ownership, but the creator can still hold the LP, the first block can still be dominated by snipers, and the early volume can still be manufactured. The FBI's 2023 cryptocurrency fraud figures show why structure matters more than hype, with more than 69,000 complaints and losses above $5.6 billion, plus investment fraud making up nearly 71% of reported crypto-related losses (FBI cryptocurrency fraud report). That's the right mindset for the list below.
Use each indicator as a verifiable check on-chain. Read distribution first, then launch mechanics, then real-time behavior. A single green flag doesn't clear a token. It only tells you which question to ask next.
Table of Contents
- 1. Top Holder Concentration
- 2. Liquidity Depth and Liquidity-to-Market-Cap Ratio
- 3. Liquidity Lock and LP Burn Status
- 4. Mint and Freeze Authority Status
- 5. Creator Wallet Holdings and Sell Activity
- 6. Creator Launch History
- 7. Launch Bundle and Sniper Activity
- 8. Insider Wallet Clustering and Funding Source Linkage
- 9. Wash Trading and Volume Authenticity Indicators
- 10. Sell Pressure and Buyer-Seller Imbalance
- 10 Token Risk Indicators Comparison
- Turning These Risk Indicators Into a Pre-Buy Checklist
1. Top Holder Concentration
Top-holder concentration is the fastest way to spot whether supply is already trapped in a few hands. Exclude pool addresses and burn wallets, then measure the share held by the top 10 or top 20 non-exempt wallets. If a small group controls most of the supply, they can move the chart together or exit together.
That pattern matters more on thin Solana launches, where a few sells can overwhelm buyers. A new meme coin can look widely held, yet the actual float is sitting with one sniper wallet and a cluster of related accounts. The number itself doesn't prove a rug, but it shows how much power the largest wallets have over the market.
Practical rule: read concentration next to liquidity depth, not by itself. A concentrated token with deep liquidity is still risky, but a concentrated token with shallow liquidity can turn into a trap fast.
A useful verification step is simple. Open the holder list, remove pool and burn addresses, then check whether the top wallets were funded from the same source or arrived in the same time window. Recheck the list at 1 hour, 6 hours, and 24 hours. If concentration falls as new holders arrive, the risk picture improves. If it stays high while liquidity stays thin, the setup is still fragile.
This holder concentration guide from MemeAssist is a good companion when you want a quick on-chain read before a buy.

2. Liquidity Depth and Liquidity-to-Market-Cap Ratio
Liquidity shows whether a sell can clear without breaking price. Market cap can look large while the pool stays shallow, and that gap makes safety easy to misread. A thin pool means even a moderate exit can move the chart sharply.
The check is simple. Compare live liquidity in SOL or USD with the token's claimed value and with your intended position size. A pool holding less than 1% of market cap in SOL is a weak setup, because a few thousand dollars of selling can become a price-impact event. That does not prove a rug. It shows the exit is fragile.
Depth matters more than headline volume. Busy trading with weak liquidity can still overstate demand, since the pool may not be able to absorb real selling pressure. The stronger read comes from the pool itself, not the marketing around the token.
Check the main pair and any secondary pools before buying. A token can show one healthier pool while a thinner pool drains exits elsewhere. Then watch for sudden liquidity drops after a spike, because that is often the point where entry looked easier than exit.
The MemeAssist analysis library on liquidity checks is useful for that review because it turns this into a pre-buy check rather than a guess.
3. Liquidity Lock and LP Burn Status
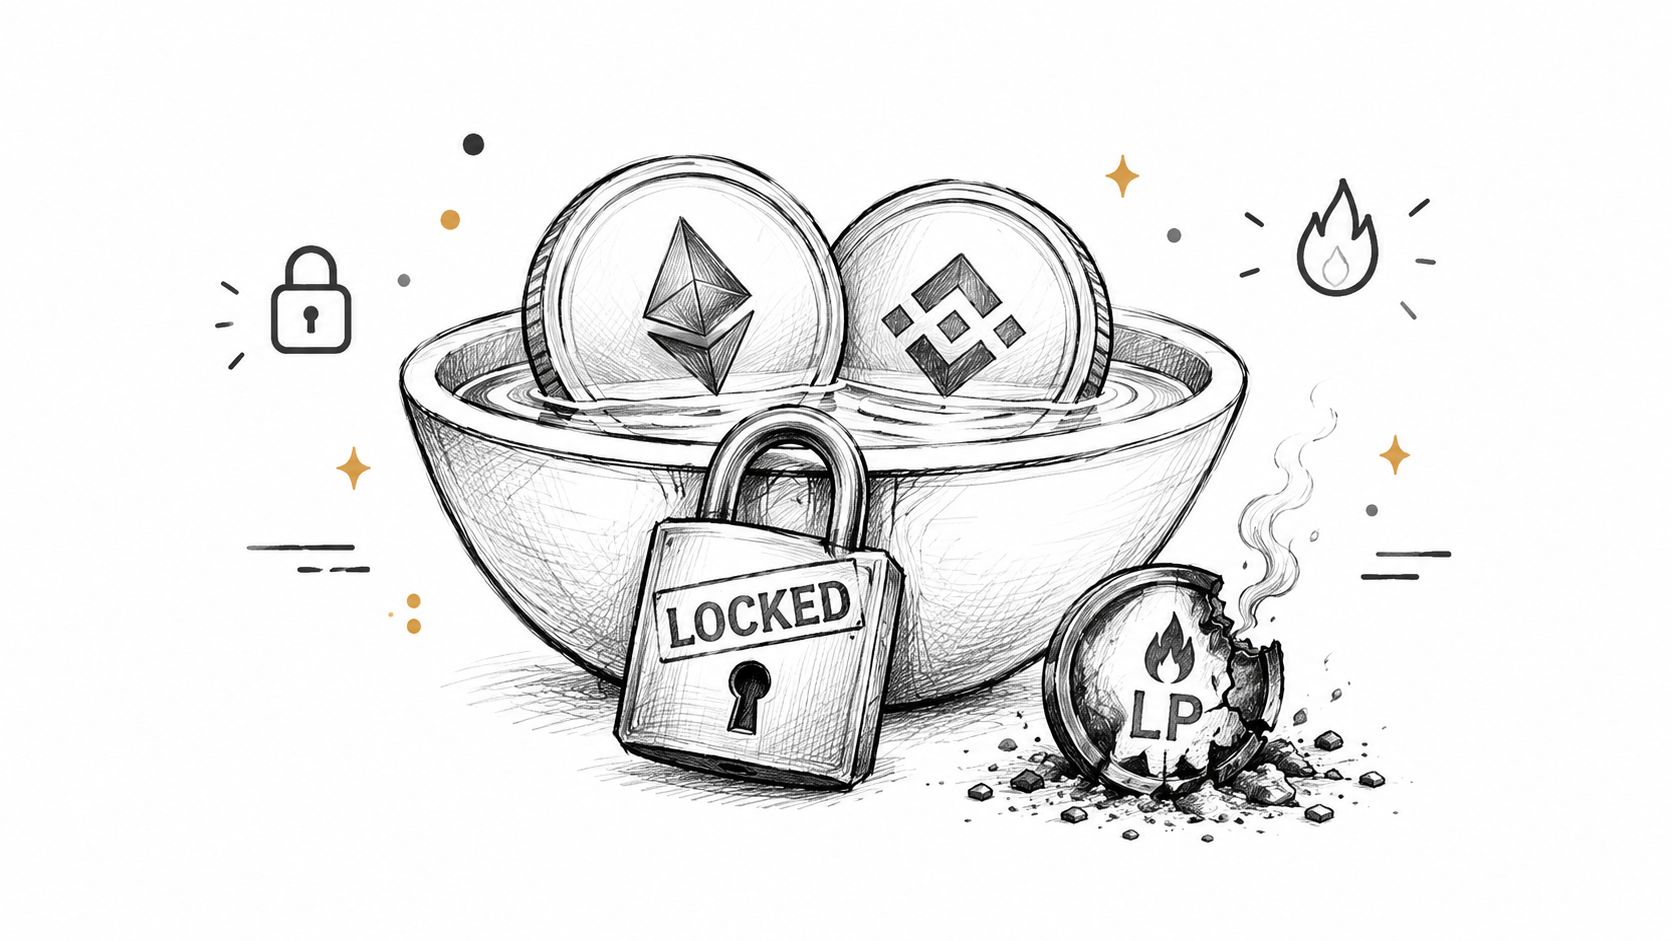
LP status is one of the few binary checks that can save you from guessing. If the liquidity provider tokens are burned or locked in a contract the creator can't reach, the pool is harder to pull. If the creator still controls those LP tokens, the exit door may be wide open.
That doesn't mean every lock is equal. Some lockers expire quickly, some contracts allow early releases, and some projects create another pool on the side. The visible lock can look reassuring while a second liquidity path makes the protection less meaningful. A lock is only useful if you understand who controls it and when it ends.
A lock protects you from a direct withdrawal, not from every version of liquidity migration.
Verify the LP tokens against a known dead address or a recognized locker contract, then check the release timestamp. If the lock sits in a wallet the creator can still access, treat it as weak. Also check whether more than one pool exists, because an open secondary pool can undermine the main one. Recheck the status later, since launches change fast and a fresh pool can appear after the first wave of attention.
4. Mint and Freeze Authority Status
Mint authority and freeze authority are hard checks, not background details. Mint authority shows whether supply can still expand. Freeze authority shows whether token accounts can still be stopped from moving. If either remains active, control has not fully left the issuer.
They measure different risks. An active mint can add new supply and weaken holders through dilution. An active freeze authority can block transfers even when the token still appears tradable. Checking only one field leaves a gap in the review.
For a clear walkthrough of how freeze controls work, see this Solana freeze authority explainer.
The verification step is direct. Open the token account and inspect both fields before buying. Do not rely on a project post that says the authorities were revoked. Confirm the on-chain state yourself, then compare it with liquidity and holder data. A revoked mint authority does not make a token safe by itself, and an active freeze authority remains a serious warning even if the chart still looks orderly.
5. Creator Wallet Holdings and Sell Activity
Creator behavior is one of the few signals that shows intent in real time. If the deployer wallet still holds a large allocation, the risk is obvious. If that wallet starts selling into buying pressure early, the person who knows the most about the launch may already be heading for the exit.
The failure mode here is disguised movement. Creators can move tokens into fresh wallets, then dump from a quieter address so the trail looks cleaner. That makes simple “creator balance” checks too weak on their own. You need both the holdings and the transfer path.
Track the deployer first, then follow every address it funds. Set alerts for large outgoing transfers and compare those transfers with price and liquidity changes. If creator-linked wallets start reducing exposure in the first hours after launch, the token deserves a severe warning. If the creator is still a top holder and the token is thinly traded, a single sale can hit the chart hard.
A practical verification step is to compare creator-linked holdings with pool depth. That tells you whether the wallet can realistically unload without crushing the price. The smaller the market depth, the more dangerous the creator's position becomes.
6. Creator Launch History
Past behavior is one of the best clues you have. A deployer who has launched dozens of tokens and watched most of them collapse leaves a pattern that should matter on the next launch too. Serial deployers often reuse timing, metadata, and wallet structure across projects.
The value of this check is historical, not predictive in a magical sense. It doesn't prove the next token will fail. It tells you whether the same wallet has already shown a repeatable pattern of short-lived launches and liquidity removal. That's enough to change the odds in a meaningful way.
What to look for
- Repeated launches: Look for many tokens from the same deployer across a short span, especially if they share the same playbook.
- Similar metadata: Names, images, and launch timing that echo past tokens can point to a reused template.
- Poor outcomes: A history of rapid collapses should weigh heavily, because it's one of the clearest warning signs available.
A brand-new wallet isn't automatically clean, either. If it's funded by an address tied to bad launches, the “fresh” wallet may only be cosmetic. The verification step is to trace the deployer's prior launches and the funding source behind the deployer. When a token is new but the wallet history isn't, treat the past as part of the current trade.
7. Launch Bundle and Sniper Activity
The first blocks after launch can tell you whether retail had a fair entry or not. Bundled buys and sniper-heavy starts often mean a few wallets acquired a large share before most traders even saw the pair. That's not just early interest. It's information asymmetry.
This indicator fails when you only look at the headline chart. A token can show a dramatic green candle and still have been captured by wallets that were positioned before public trading settled. If those wallets sell into the first pump, retail becomes the liquidity source for their exit.
Check the first few blocks after launch and note how much supply those wallets picked up. Then watch what they do during the first spike. If early buyers start unloading right away, they probably weren't long-term believers. They were inventory holders waiting for demand.
Verification step: compare early block activity with funding-source links. If several early wallets share the same origin, the “organic launch” story gets weaker.
Avoid chasing a fresh token when early wallets already hold a dominant share. A crowded opening often means the best price has already been taken by someone else. On Solana, that matters because launch mechanics can change in minutes, not hours.
8. Insider Wallet Clustering and Funding Source Linkage
A holder list can be fake-diverse. Wallet clustering shows whether separate addresses are controlled by the same entity or the same group. Shared funding sources, synchronized transfers, and matching timing patterns often expose concentration that top-holder charts hide.
Many traders misread risk. They see a long list of wallets and assume dispersion. Then cluster analysis shows that several of those wallets moved in lockstep from the same funder. The token wasn't broad-based at all. It was centrally controlled in smaller pieces.
That's why clustering works best as a correction to concentration, not a replacement for it. If the top wallets all share funding or sell together, the risk is higher than a standard holder chart suggests. If the wallets are independent and their behavior diverges over time, the risk picture is less extreme.
A clean verification routine
- Trace funding sources: See whether the top wallets were seeded by the same origin wallet.
- Watch transfer timing: Wallets that buy and sell together are rarely independent in practice.
- Compare movement patterns: Clusters that offload at the same time deserve more weight than isolated holders.
Analytics firms like Bubblemaps have publicized this kind of cluster view in Solana launches, which is useful because it shows how hidden concentration can sit behind a clean-looking holder list. The point is not to label every cluster as bad. The point is to stop trusting the headline distribution without checking who controls it.
9. Wash Trading and Volume Authenticity Indicators
Volume only helps if it's real. Wash trading inflates activity to lure buyers into thinking a token is liquid and widely traded. The fake signal is seductive because it makes a dead market look alive.
The simplest check is to compare reported volume with the number of unique traders. If the volume is high but the trader count is tiny, the activity may be circular. Trade-size repetition can also give the game away, especially when the same fixed amounts keep appearing over and over. That kind of symmetry is hard to ignore.
MemeAssist's wash trading detection guide for Solana is directly relevant because it separates activity from authenticity. The question isn't whether trades exist. It's whether those trades reflect actual market interest.
Look for volume spikes that don't match holder growth or social traction. If there's no corresponding expansion in unique participants, the chart may be manufacturing attention. Treat volume authenticity as one input, not as a final verdict. Real trading activity should leave footprints across multiple parts of the market, not just one noisy metric.
10. Sell Pressure and Buyer-Seller Imbalance
Sell pressure shows what the market is doing right now. A token can look fine on holder count and still be bleeding as sellers outnumber buyers over several windows. That imbalance matters because it captures distribution before the chart breaks fully.
Use more than one window. A five-minute burst can be noisy, and a single hour can miss the larger pattern. What matters is whether sellers keep dominating while price weakens. If early wallets are among the sellers, the risk rises again, because the people closest to the launch may already be cashing out.
The verification step is to compare sell count, buy count, seller count, and buyer count across short and longer windows. Then ask whether the sellers are new wallets, early holders, or part of a linked cluster. That extra layer matters because the same sell count means different things depending on who is selling.
If sell pressure rises while liquidity falls, the downside can move fast.
A token with steady buyer interest can still be dangerous if early holders keep distributing into it. A token with rising sells and thin depth is worse. That combination tells you the exit market is shrinking at the same time demand is weakening.
10 Token Risk Indicators Comparison
| Indicator | Implementation Complexity 🔄 | Resource Requirements ⚡ | Expected Outcomes 📊 | Ideal Use Cases 💡 | Key Advantages ⭐ |
|---|---|---|---|---|---|
| Top Holder Concentration (Top 10 / Top 20 Share) | Low 🔄, quick on-chain reads | Low ⚡, balance queries only | Fast concentration signal; predictive of dump risk 📊 (⭐⭐) | Early screening and quick launch checks | Transparent, hard to fake, easy to explain ⭐ |
| Liquidity Depth & Liquidity-to-Market-Cap Ratio | Medium 🔄, aggregate pool data | Medium ⚡, price and pool aggregation | Quantifies exit/slippage risk and fragility 📊 (⭐⭐) | Estimating trade impact, exit planning | Directly tied to exit risk; pairs with price-impact models ⭐ |
| Liquidity Lock & LP Burn Status | Low-Medium 🔄, verify contracts/timestamps | Low ⚡, on-chain lock/burn checks | Binary safety signal (locked/burned vs controllable) 📊 (⭐⭐⭐) | Pre-purchase safety verification | Objective, verifiable; strong protection when burned ⭐ |
| Mint & Freeze Authority Status | Low 🔄, single mint-account read | Low ⚡, mint account data | Binary control signal; prevents mint/freeze attacks 📊 (⭐⭐⭐) | Immediate pre-buy due diligence | Quick, decisive signal; easy to verify and explain ⭐ |
| Creator Wallet Holdings & Sell Activity | Medium 🔄, tracing + ongoing monitoring | Medium-High ⚡, transfer history & alerts | Leading indicator of dumps; actionable alerts 📊 (⭐⭐⭐) | Post-launch monitoring and deployer behavior tracking | Reveals alignment with holders; strong early warning ⭐ |
| Creator Launch History (Serial Deployer Detection) | Medium-High 🔄, historical linkage & heuristics | High ⚡, historical data and attribution | Historical risk scoring; exposes repeat bad actors 📊 (⭐⭐) | Vetting creators and risk-scoring projects | Captures behavioral patterns invisible in snapshots ⭐ |
| Launch Bundle & Sniper Activity | High 🔄, block-level bundle detection | High ⚡, block/tx-level data & timing | Early insider detection; supply-capture signal 📊 (⭐⭐) | First-block analysis and insider extraction detection | Detects coordinated early extraction; predictive with concentration data ⭐ |
| Insider Wallet Clustering & Funding Linkage | High 🔄, probabilistic clustering | High ⚡, large-scale tracing & heuristics | Reveals hidden concentration; probabilistic but actionable 📊 (⭐⭐) | Exposing linked wallets and adjusting concentration scores | Exposes concealed insider groups; improves risk accuracy ⭐ |
| Wash Trading & Volume Authenticity Indicators | Medium 🔄, pattern analysis across trades | Medium ⚡, trade histories, unique-trader counts | Detects fake momentum; filters misleading volume 📊 (⭐) | Verifying volume quality before trading | Reveals manufactured activity; complements other checks ⭐ |
| Sell Pressure & Buyer–Seller Imbalance | Medium 🔄, real-time trade aggregation | Medium ⚡, live swap/volume feeds | Real-time distribution signal; early warning of declines 📊 (⭐⭐) | Short-term market monitoring and trading decisions | Responsive, easy to read; estimates near-term selling risk ⭐ |
Turning These Risk Indicators Into a Pre-Buy Checklist
No single signal clears a Solana meme coin. A clean LP lock doesn't fix concentrated ownership. A broad holder list doesn't fix bundled launches. A busy chart doesn't prove real demand. The right way to use risk indicators examples is as a chain of checks that get sharper as the trade gets closer.
Start with authority and LP status. If mint, freeze, or liquidity control is weak, stop there or reduce size sharply. Then move to distribution, clustering, and creator behavior, because those tell you who really controls supply and who is likely to sell first. After that, inspect launch mechanics and volume authenticity, since early bundle buys and fake activity can hide a bad entry. Finish with sell pressure and buyer-seller imbalance, because real-time flow often confirms what the earlier checks were hinting at.
The best traders don't ask, “Is this token safe?” They ask, “What would have to be true for this token to be safe, and which checks can verify that on-chain?” That's a better question because it forces each indicator to prove something specific. It also keeps you from overreacting to one scary metric or trusting one reassuring metric too much.
Use one live token address today and run the sequence in order. Check mint and freeze authority, then LP status, then top-holder concentration, then creator-linked wallets, then launch clustering, then volume authenticity, then sell flow. If two or three signals point the same way, the trade deserves more caution than the chart alone suggests. If you want a single place to centralize that read, MemeAssist is built to combine liquidity, holder distribution, creator behavior, wallet activity, trading patterns, and historical risk indicators into one on-demand Solana report.
MemeAssist helps you apply these checks to a live Solana token without guessing from the chart alone. It combines on-chain evidence with a plain-English risk read, so you can review holder concentration, creator behavior, liquidity, and trading patterns before you buy. Visit MemeAssist to run a token through the same style of risk screening covered here.