Whale Wallets Crypto Explained: How to Track Big Holders
Learn what whale wallets crypto holders are, how their trades move prices, and which on-chain signals and Solana checks help traders track them.
Published
Updated
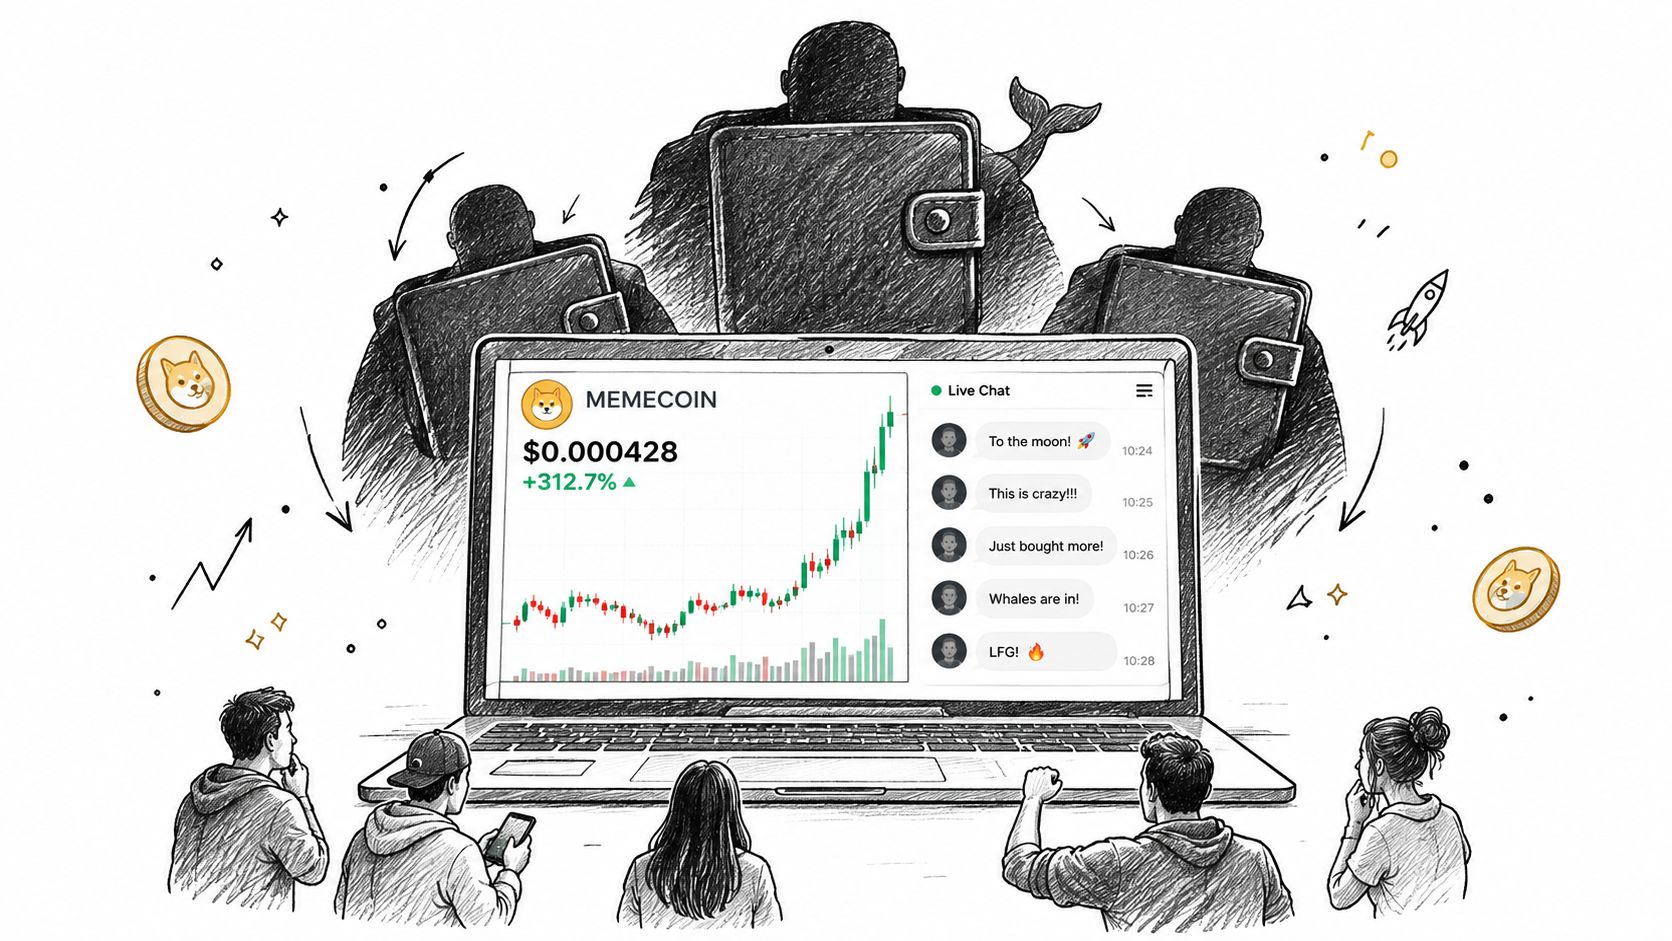
You bought a Solana meme coin because the chart was ripping and the chat was loud. Price doubled in a few minutes. Then it gave a large piece of that move back before you finished the thread. Almost nobody opened the holder list.
That gap is what tracking whale wallets crypto is meant to close. A small group of large holders, or a quiet set of wallets that act like one holder, can decide how much selling the pool can absorb. On a thin launch, that decision shows up as a wick.
This is the desk version of the check. You'll see what counts as a whale, how those wallets change price and liquidity, which on-chain signals are worth logging, and a Solana workflow you can run before you size the trade.
Table of Contents
- Why Whale Wallets Matter for Crypto Traders
- Defining Whale Wallets Beyond a Single Address
- How Whale Activity Moves Prices and Liquidity
- On-Chain Metrics for Spotting and Monitoring Whales
- Tracking Whale Wallets on Solana Step by Step
- Real-World Whale Patterns and Managing Their Risk
- Choosing a Whale Tracking Setup and Your Next Step
Why Whale Wallets Matter for Crypto Traders
A meme coin chart jumps hard in an hour. The chat fills with excitement. The holder tab stays closed. That's the usual sequence, and it's the one that leaves newer traders confused when the candle reverses.
Large wallets sit in the middle of that miss. If a small set of addresses controls a big slice of supply, those holders decide how much selling the market can take before price gaps. History makes the point clearer than one screenshot. Glassnode research on whale addresses defines a whale address as one holding more than 1,000 BTC. Whale-controlled supply was approximately 76% of Bitcoin's total supply at the 2011 peak, about 62% at the 2013 peak, and roughly 52% at the 2017 peak. The 2021 peak sat near 53%, then the share fell to around 39% by September 2023. From the start of 2023 to mid-2023, whale-controlled circulating supply eased from 41.3% to 40.4%.
Ownership spread as Bitcoin matured. The market is still exposed to a relatively small group of large holders.
Thin books versus deep books
A deep market can absorb a large sale with a modest move. A new Solana meme coin often can't. The same economic actor who is a small slice of Bitcoin can be most of the tradable float on a fresh pool. Transfers toward an exchange or a pool can add coins that are available to sell immediately. Withdrawals can pull that supply back off the market.
Glassnode draws a line that trips people up. An address isn't an investor. Exchanges, custodians, and related wallets can make address-level concentration look larger or smaller than the ownership of actual people. You still watch the balances, because the flow changes sell-side liquidity.
Practical rule: If the holder list is unchecked, you don't know how much selling the pool can absorb.
The trade-off is time versus surprise. A few minutes on concentration won't call the next candle. It will tell you whether one actor can overwhelm the bids you plan to exit into.
Defining Whale Wallets Beyond a Single Address
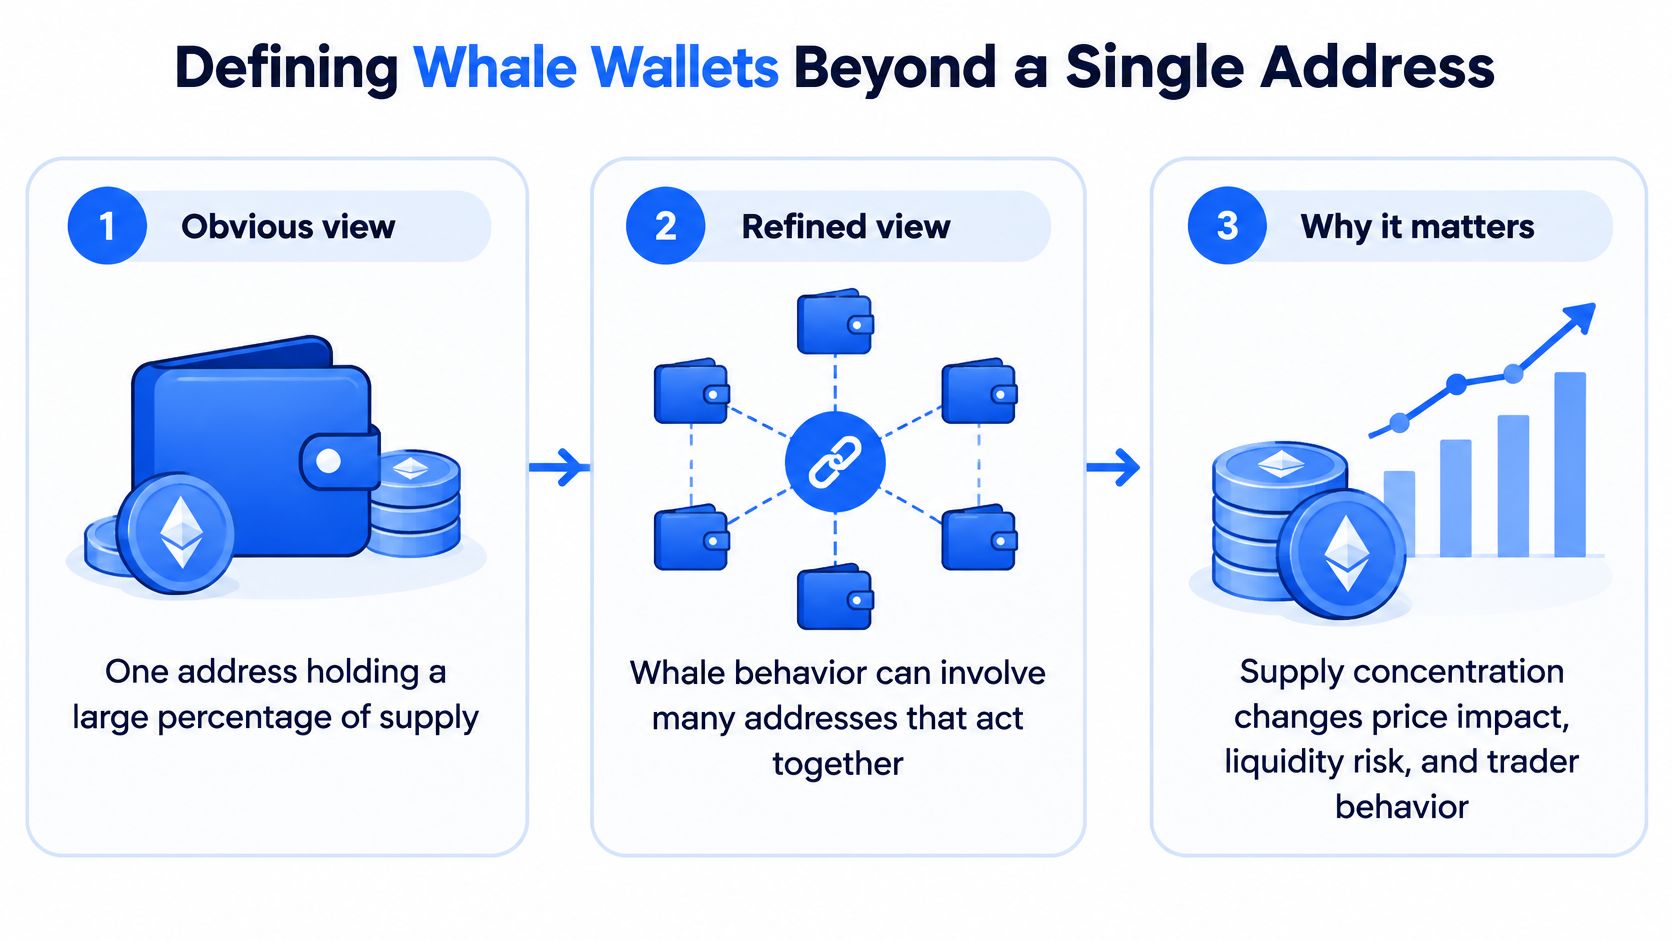
Most traders start with the obvious picture. One address holds a large percentage of supply, so that address is the whale. The picture breaks the first time you open a real holder list.
Think of cash split across envelopes. Ten envelopes in one drawer are still one person's budget. Splitting tokens across ten addresses doesn't create ten independent investors. Control stays with whoever can move the stack.
What only looks like a whale
Raw top-holder percentages mix several kinds of wallets.
- Exchange and liquidity-pool addresses: These hold tokens so other people can trade. A large pool balance is market inventory, not one trader waiting to dump.
- Creator-controlled wallets: A deployer, a marketing wallet, or fresh addresses funded from the same source can look scattered and still share one decision maker.
- Burn and treasury addresses: Locked, burned, or operational balances aren't freely tradable. Counting them as sell pressure overstates the risk. Ignoring a treasury the team can still move understates it.
- Coordinated clusters: Many smaller wallets can behave as one position if they share a funder, buy in the same minute, and sell together.
Solana meme-coin research analyzed more than 7.7 million wallets and found purchasing clusters of roughly 450–2,000 wallets entering within one to two minutes of launch, according to reporting on those launch clusters. Those clusters later doubled at rates of 28%–46%, but their entry was followed by a 40% decline in 50%–60% of cases, compared with 17% for other wallets. A coordinated group can be more informative, and more dangerous, than one visibly huge holder.
How you separate distribution from fragmentation
Genuine distribution means unrelated people bought at different times, from different funding sources, and don't exit together. Fragmentation means one actor spread funds so no single line looks scary.
Watch common funders, identical timing, repeated creator links, and synchronized sells. Then add the cluster's net exposure instead of celebrating a long holder list. A guide to Solana wallet clusters helps when the holder page looks spread out but the funding graph doesn't.
The working definition from here is simple. A whale is the set of economically related wallets that can move a meaningful share of circulating supply together. One address is only the easy case.
A short walk-through of clustered holder behavior, before the price mechanics:
How Whale Activity Moves Prices and Liquidity
Concentration changes price through the float, not through drama.
When related wallets lock up a large share and don't trade it, less supply is left for everyone else. Each market sell then walks further through the bids. The chain is concentration, lower available float, larger price impact per sale, then sharper swings and weaker exits.
A simulated small-world market makes the scale concrete. Raising the share of whale investors from 1% to 6% produced a 104% increase in daily volatility, as reported in an artificial Bitcoin market study. That figure comes from a simulation. It doesn't mean your token gets twice as wild if whales grow from 1% to 6%. It shows how concentrated traders amplify moves when their size is large next to available liquidity.
Ethereum shows a similar shape in live holdings. Federal Reserve Bank of Philadelphia research found that more than 95% of Ethereum wallets held less than $1,000 worth of ETH, while wallets holding more than $1 million accounted for over 55% of the market's ETH. The same research notes that long holding shrinks the supply in circulation, which feeds both liquidity and volatility.
Four behaviors and what they do to the book
Not every large balance is a sell order.
- Long holding: Coins sit still. Active float shrinks. Later sells hit harder, even if nothing looks urgent today.
- Transfers toward venues: Coins move to an exchange or onto a path that can be sold quickly. Near-term sell capacity rises. Intent still isn't proven, because collateral moves and internal shuffles exist.
- Withdrawals away from venues: Coins leave the place where they can be sold fast. Near-term sell pressure often eases. It can also just be custody.
- Synchronized buys: Related wallets lift price before most traders notice the chart. If the same cluster later sells together, the lift was inventory, not a crowd.
A large balance you can't sell into a deep book isn't the same risk as a large balance on a shallow pool.
Judge the cluster against executable liquidity, not against market cap. A Solana liquidity check belongs next to the holder list. If the pool can't absorb a fraction of the cluster without a violent move, that whale can move the price whether or not the wallets look active.
On-Chain Metrics for Spotting and Monitoring Whales
A single top-holder percentage flatters whichever moment you screenshotted. Read the signals in order, because each one fixes a mistake the last one can make.
Effective concentration comes first. Add the share of circulating supply held by economically related wallets, then strip pools, exchanges, burn addresses, and treasuries you can't treat as free sellers. What's left is closer to tradable control.
Cluster exposure comes next. A modest top-10 line can hide a group that shares funders. Net the group. Don't average it away into a comforting holder count.
Transfer direction tells you whether that supply is moving toward a trading venue or away from one. Toward usually raises near-term sell capacity. Away usually lowers it.
The checks people skip
Wallet age separates a launch-day burst from coins that have sat idle. Fresh wallets that appear together deserve more suspicion than an old holder who hasn't moved.
Liquidity depth relative to those holdings answers the sizing question. Can the pool absorb a realistic sale from this cluster?
Timing of synchronized transactions is the behavior check. Buys or sells in the same narrow window, repeated across the cluster, matter more than one fat wallet that never moves.
Change beats the snapshot. Stable long-term ownership is a different risk from rapid accumulation by related wallets followed by synchronized transfers to a venue. The second pattern is the higher-risk one. Log the level, then log the change.
| Signal | What It Shows | Why It Matters |
|---|---|---|
| Effective concentration | Share of circulating supply in related wallets after pools, exchanges, burn, and treasury lines are removed | Stops raw top-holder math from inventing sell pressure |
| Cluster exposure | Net tokens controlled by wallets with shared funders or shared behavior | Catches control that a long holder list hides |
| Transfer direction | Moves toward or away from exchanges and pools | Changes how much can be sold right now |
| Wallet age | How long the coins have sat | Separates patient holders from launch-window bursts |
| Liquidity versus holdings | Pool depth next to the cluster's size | Tells you the price impact of a realistic sale |
| Synchronized timing | Buys or sells landing in the same narrow window | Distinguishes a crowd from one actor |
Build the checklist from that table, and pull a fresh Solana holder check after the price has already moved. The percentage you remember from yesterday isn't the book you're trading today.
Tracking Whale Wallets on Solana Step by Step
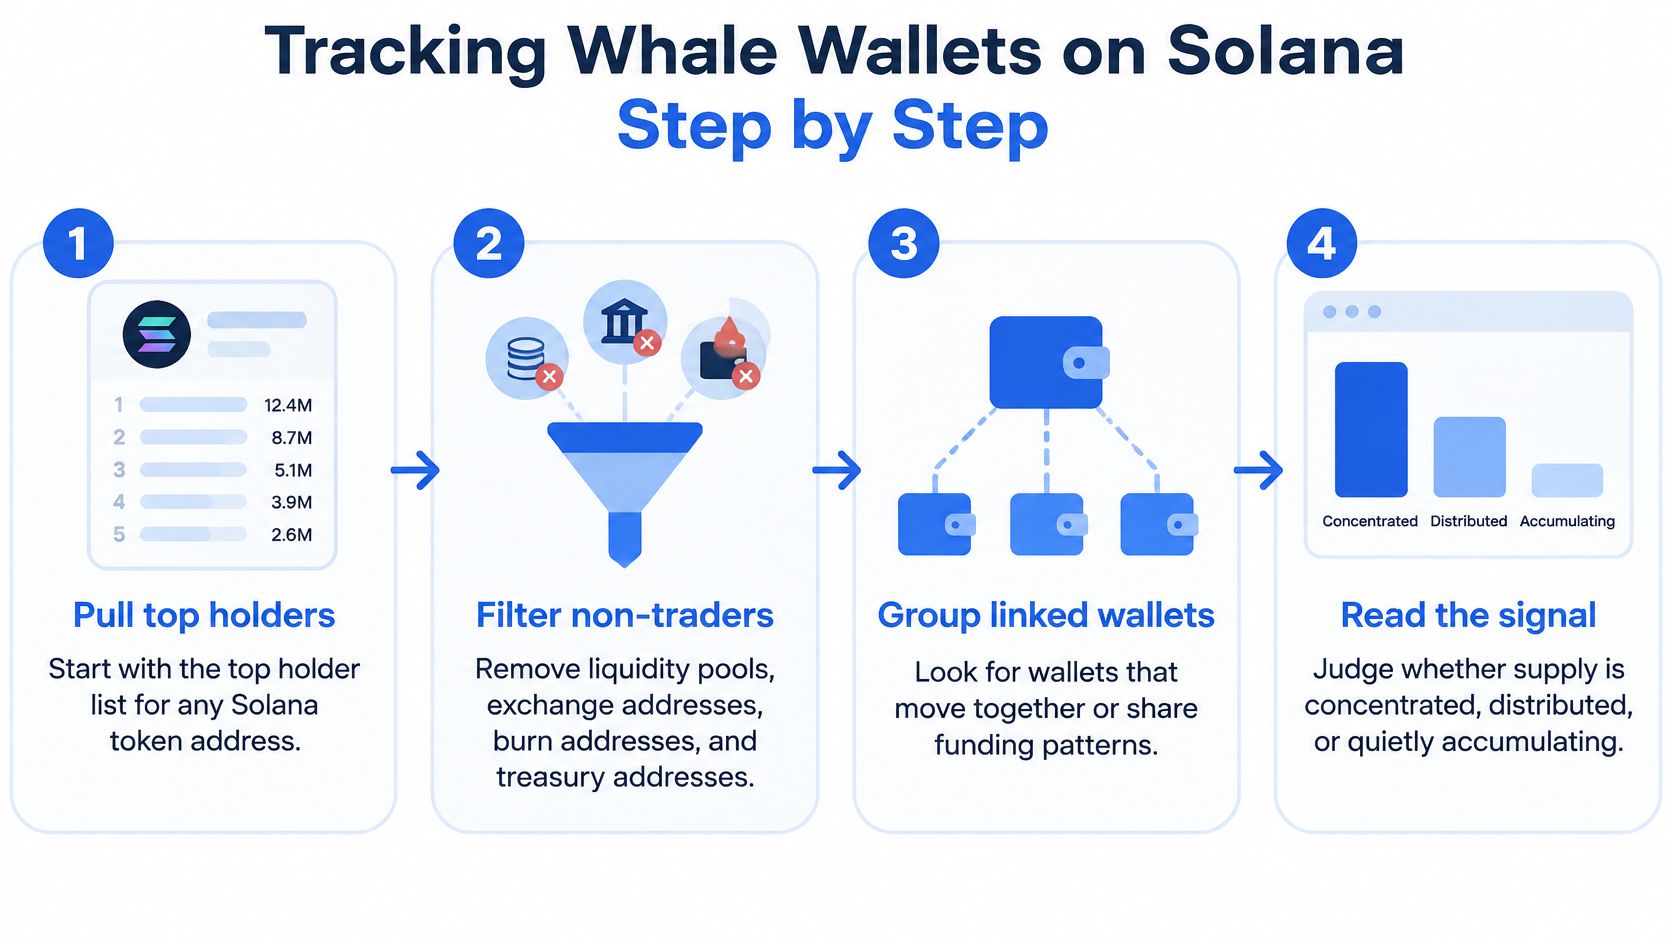
Run the same pass on any Solana token address. Launches are cheap and fast, so clusters can form before a manual reader finishes the chart.
Clean the holder list
Start with the top holder list. Cross off liquidity pools, known exchange addresses, burn addresses, and treasury or operational wallets. Write down what you removed and why. If you skip the note, you'll argue with yourself on the next check about whether the big line was a pool.
What's left is the candidate set. It still isn't a list of independent people.
Group what moves together
Sort the remaining wallets by common funders, purchase timing, and shared sell behavior. Wallets funded from one source in the same minute belong on one row of your log, even if each balance looks small. The first minutes after launch deserve a slower look than a token that has traded for weeks. The launch-window clusters covered earlier are the reason. You don't need a new theory. You need the clock.
Log concentration against liquidity
Record two figures: effective concentration of the related group and executable liquidity in the pool you would trade. Recheck at set intervals and again after any sharp price move. A log beats memory, because memory keeps the number that made you comfortable.
Turn the log into alerts you can act on without staring at the chain all day.
- Accumulation jump: Related wallets add supply quickly after you first measured them.
- Venue transfers: A cluster that was sitting still starts moving toward a pool or an exchange path.
- New funding link: Fresh wallets appear with the same funder as the creator or an existing cluster.
- Liquidity shrink: Pool depth falls while concentration stays high, so the same holding gets more dangerous without anyone buying more.
The pass is deliberately boring. Boring is what you can repeat on the tenth token of the day, which is when shortcuts start.
Real-World Whale Patterns and Managing Their Risk
Metrics help only if you can see them as a trade. These two scenes are illustrative. They're built from the signals above, not from a reported blow-up of a named coin. The liquidity contrast comes from the same market-structure discussion cited earlier.
Scene one is a holder, or a tight cluster, with 8% of supply. Put that holding next to $200,000 of executable liquidity and a sale doesn't need to be the full 8% to gap the chart. Put the same 8% next to $20 million of executable liquidity and the holder is still large, but the book can absorb far more before your exit breaks. Same percentage. Different job for your position size.
Scene two is the launch cluster. Wallets show up within a minute or two of the first trades, then later transfer toward a trading venue together. The chart can look strong while they buy. The risk shows up when the transfers line up. You don't need every wallet to be huge. You need them to be related and able to sell into the same pool.
Rules you set before the buy
- Size against executable liquidity, not market cap. If a realistic fraction of the cluster can't exit without a violent move, your size is too big even when the narrative is strong.
- Don't treat a low top-holder percentage as safety. Fragmented lines can still be one actor. If the funding link is there, a pretty distribution chart isn't a green light.
- Write the exit before you enter. Decide which concentration change or venue transfer cancels the trade. Hoping you'll watch it after a hard wick isn't a rule.
- Reassess when the log changes. A stable holder can become a seller. The first measurement is a start, not a hall pass.
Desk habit: If you can't say who could sell, how they'd reach the pool, and whether the pool can take it, you don't have a position. You have a guess.
These rules won't remove volatility. They stop you from confusing a crowded holder list with a safe one.
Choosing a Whale Tracking Setup and Your Next Step
You can track whales three ways. The right one depends on how many tokens you touch and how fast the book moves.
Manual explorer checks give you full control. You open the holder list, follow a funder, and read transfers yourself. Coverage is as good as your patience. Cluster detection is slow, the data is only as fresh as your last click, and the time cost explodes past a couple of launches.
A spreadsheet plus alerts is the middle step. You paste cleaned concentration, the liquidity figure, and the cluster notes into a log, then alert on large transfers. You keep the judgment. You still cluster by hand, so a busy Solana hour will outrun the sheet.
A dedicated risk analyzer trades some control for speed. You want cluster detection, a live read, holder concentration, and wallet activity in one pass. Doing those checks across separate tools is how people skip the cluster and trust the top-10 percentage.
MemeAssist sits in that third group as a Solana-focused analyzer. It builds an on-demand report from live on-chain and market data, covering holder distribution, wallet activity, and trading patterns that include bundle and insider detection. The report returns an Overall Health Score, a Rug Risk Rating, an AI Verdict, and a Detailed Risk Breakdown. It doesn't replace the log or the decision. It shortens the evidence pull. New users get one free full analysis, and you don't connect a wallet to run it.
If you trade one careful position a week, the explorer plus a written log is enough. If you screen many launches, hand clustering fails on the day you're tired.
Run the workflow on one token you hold or are about to buy. Write effective concentration, cluster links, and pool liquidity in the log. Then compare that page with a report on the same address and see where your pass and the report disagree. The disagreement is the part worth your time.
MemeAssist turns that holder and cluster check into an on-demand Solana report, with holder distribution, wallet activity, and trading-pattern flags beside an Overall Health Score and a Rug Risk Rating. Use it when you want the whale-wallet picture before you size a meme coin, not after the wick. Start with the token you're watching at MemeAssist.