What Is Concentration Risk in Crypto Trading
Learn what is concentration risk in crypto and how whale holders, linked wallets and thin liquidity can quietly dominate token outcomes before you buy.
Published
Updated
A fresh Solana launch is moving fast, your feed is filling with green screenshots, and your finger is hovering over buy. That exact moment, not after the candle turns red, is when you need to understand what concentration risk is and check who controls the supply you're about to join. One wallet, one linked cluster, or one shallow pool can undo a good entry faster than a bad narrative can.
Table of Contents
- The Moment You Should Be Thinking About Concentration Risk
- What Concentration Risk Actually Means in Crypto
- How to Measure Concentration Step by Step
- Red Flag Thresholds That Should Change Your Trade
- Two Meme Coin Scenarios That Change the Math
- A Practical Monitoring Workflow Before Every Buy
- How MemeAssist Folds This Into a Solana Token Report
- Concentration Risk Questions Traders Keep Asking
The Moment You Should Be Thinking About Concentration Risk
You're looking at a ticker that's minutes old. Volume is climbing, someone in chat says the deployer is clean, and the holder count looks healthy at first glance. It feels like waiting costs you money.
That feeling is normal, and it's also why concentration gets skipped. Most traders check price, liquidity, and social noise, then treat holder distribution as trivia for later. By the time later arrives, the wallets that mattered have already sold into you.
What Changes Before the Buy
Before you buy, a concentration check can change three things. It can stop the trade, shrink your size, or shorten your holding period. After you buy, that same information only explains why you're stuck.
Think of it as asking a simple question. If the biggest holders decide to leave at the same time, can this market absorb them without collapsing under your position? If you can't answer that, you don't yet know the trade you're taking.
Before you click: Your risk isn't only how much of your capital goes into one token. It's also how much of that token sits with a few wallets that can move first.
This guide builds a six-step check you can run quickly. You'll look at holder share, inequality across holders, owner flags, correlated wallets, liquidity depth, and actual trading behaviour. Each step catches something the others miss.
It won't tell you which meme coin will run. It won't replace contract checks or your own sizing rules. What it will do is show you when a token that looks widely held is really controlled by a narrow group, so you can decide with open eyes instead of trusting a headline percentage.
What Concentration Risk Actually Means in Crypto
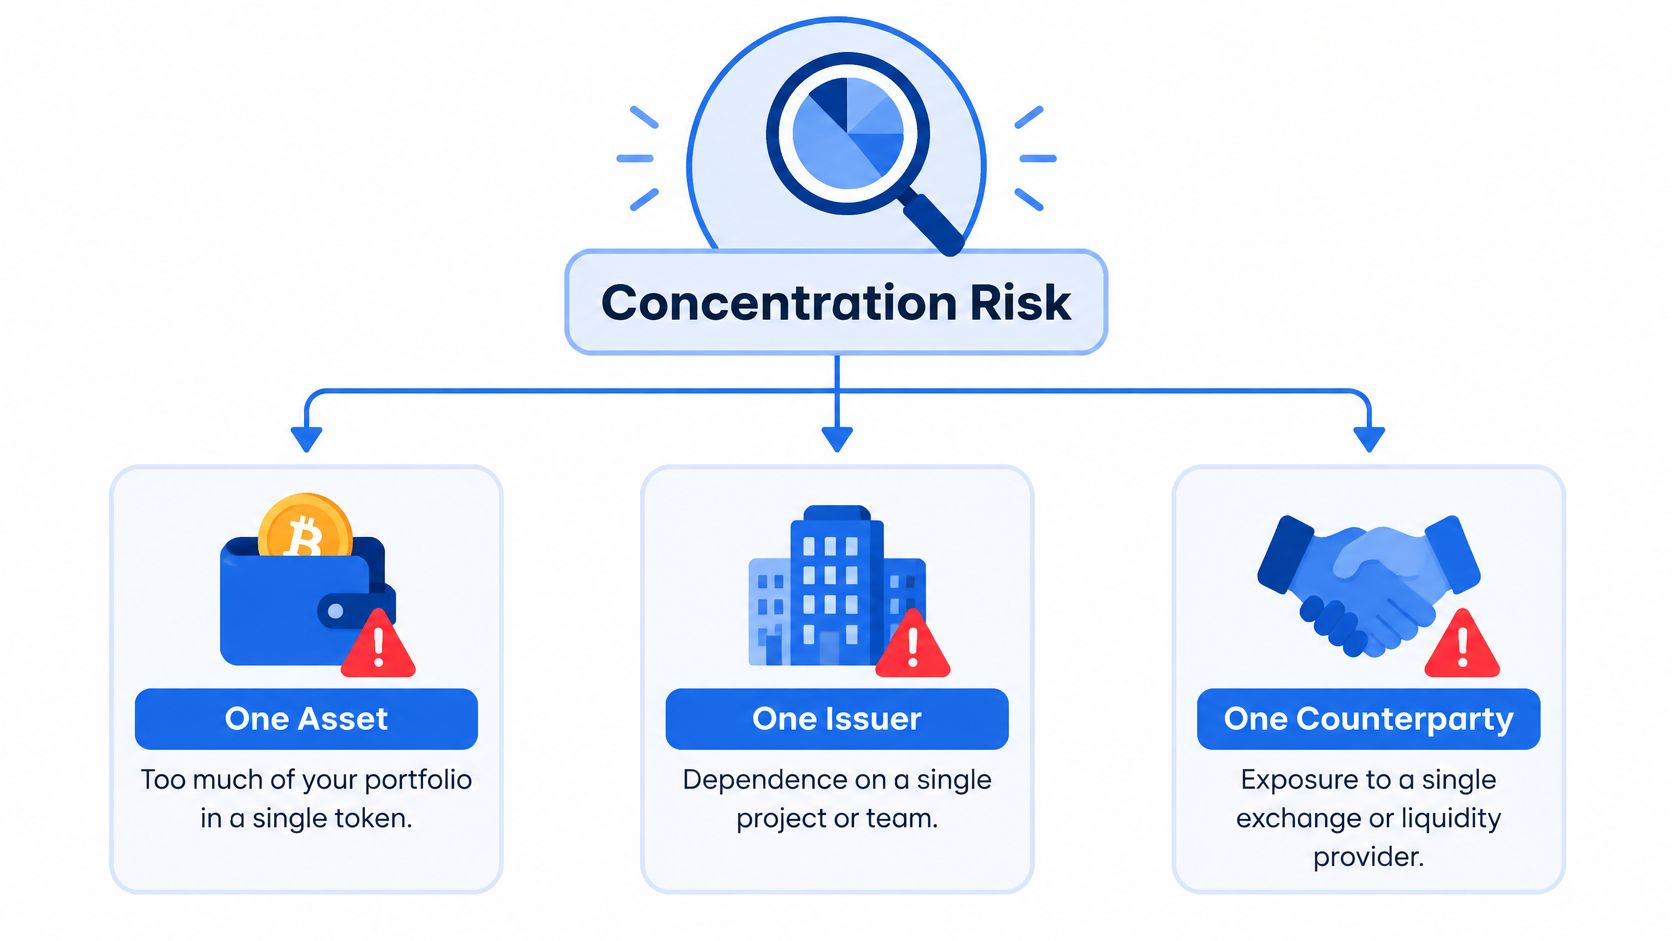
Concentration risk is the possibility that too much exposure is tied to one asset, issuer, counterparty, sector, geography, or correlated group, so losses become disproportionately large when that one thing goes wrong. That's the working definition behind State Street's explanation of concentration and diversification, and it maps cleanly onto token trading.
The obvious version is personal. You put too much of your own capital into a single meme coin, so one dump wrecks your week. That's asset concentration, and position sizing fixes it.
The Look-Through Version Most Traders Miss
The trickier version is ownership concentration. A wallet holding 30% of a token's supply, or several related wallets controlling a similar amount, can overwhelm available liquidity with one sell or coordinated transfers. You didn't concentrate your portfolio, but you bought into a concentrated token.
Then there's hidden correlation. Ten tokens can still be one bet if they share the same launch platform, liquidity venue, market maker, deployer wallet, or insider network. Assets that look different lose value together when they share the same economic driver, a point that sits at the core of the definition above.
- Asset concentration: Too much of your capital in one token or one narrative.
- Ownership concentration: Too much of a token's supply in a few wallets or one linked cluster.
- Liquidity concentration: Trading depends on a single pool or venue that can be pulled.
- Infrastructure concentration: Several holdings depend on the same deployer, platform, or service provider.
Carry this one line forward. Concentration risk asks how many independent sources of risk exist, not how many token names or addresses you can count. Your screen has to answer who can sell, whether they might act together, and whether the market can absorb them if they do.
How to Measure Concentration Step by Step
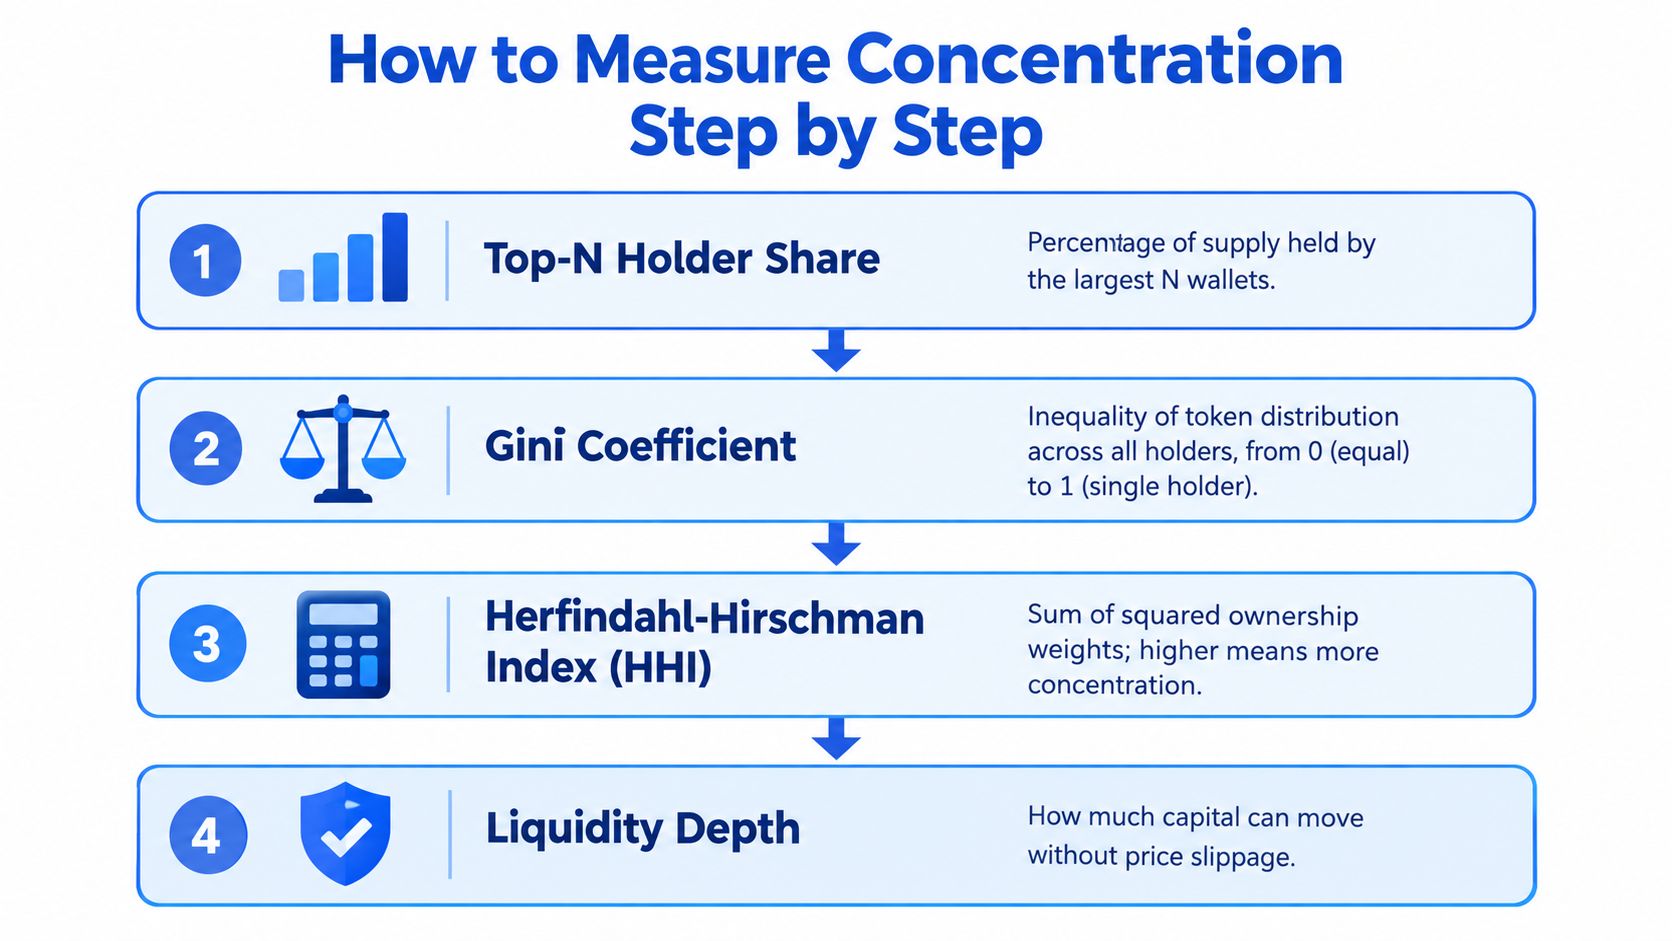
A holder count tells you almost nothing on its own. A token can list thousands of wallets and still rest on a handful of balances. Measuring concentration means running four checks that each answer a different question, then asking whether they agree.
Begin with top-N holder share. Look at the largest wallet, then the combined share of the top 10 or top 20. This tells you how much supply can hit the market from a small group. Its weakness is that it treats every address as independent, which is exactly where it can mislead you. Ten wallets funded from one source can behave like a single holder wearing several addresses, so a low top-1 number is only reassuring once you look through the cluster behind it.
Next, read the Gini coefficient. It summarizes inequality across all holders on a scale from equal distribution to single-holder control. A token can have thousands of holders and still score badly if most supply hugs the top.
Two Measures That Reward a Second Look
The Herfindahl-Hirschman Index is calculated as the sum of squared portfolio weights, and squaring the weights punishes dominance: big holders count far more than small ones, which is the point. Supply spread evenly across many wallets scores low. A few wallets towering over the rest scores high, even when the raw holder count looks healthy.
Then check owner-flagged wallets. Exchange hot wallets, liquidity pool addresses, sniper bots, and deployer accounts shouldn't be read like ordinary holders. A pool holding supply isn't the same threat as an insider holding the same amount, and a funded deployer wallet deserves different scrutiny than a renounced one.
- Top-1 and top-10 share: your first, fastest read on who can move price.
- Gini coefficient: your check on whether holder count is flattering the spread.
- Herfindahl-Hirschman Index: your summary of dominance, weighted toward the largest wallets.
- Owner flags: your filter for addresses that need context before they count as risk.
Run them in that order with a Solana holder checker that maps the full distribution. The look-through view is what you get back: linked wallets sharing a funding source, or a market leaning on one pool, surface as disagreement between these four numbers before they surface as a sell-off.
Four numbers, read together, beat one number read alone. Disagreement between them is itself a warning.
Red Flag Thresholds That Should Change Your Trade
Banking gives you a useful anchor for thinking in thresholds. Under the Basel large-exposure framework from the Bank for International Settlements, an exposure becomes a large exposure at 10% of Tier 1 capital and must not exceed 25% of Tier 1 capital. The lesson isn't the banking rule itself. It's that exposure gets judged against loss-absorbing capacity, not in absolute terms.
Translate that to a token. A holder's percentage of supply matters alongside liquidity depth, trading volume, related-wallet links, and whether that holder can sell without collapsing the market. A large holder in a deep market is manageable. The same holder in a thin market is the whole risk.
A Tiered Rule You Can Apply in Seconds
Use these practical flag levels as a starting screen, then adjust for liquidity. A single wallet above roughly 10 to 15% of supply deserves a hard look, and a top-10 group above half the supply means a handful of decisions control your exit.
| Signal | Threshold to flag | Suggested response |
|---|---|---|
| Single wallet share | Above roughly 10 to 15% of supply | Shrink size, demand deep liquidity |
| Top-10 combined share | Above 50% of supply | Watch closely or skip |
| Deployer or creator wallet | Still funded and active | Treat as unresolved supply risk |
| Liquidity venue | One pool dominates trading | Check depth before sizing |
| Linked wallet cluster | Several top wallets share funding | Count them as one holder |
Pair the holder read with a Solana liquidity checker for pool depth before you commit. Thresholds protect you against a specific failure, which is a forced exit into a market that can't absorb the sellers ahead of you. If two or more rows flag at once, don't average them away. That combination is the signal.
Two Meme Coin Scenarios That Change the Math
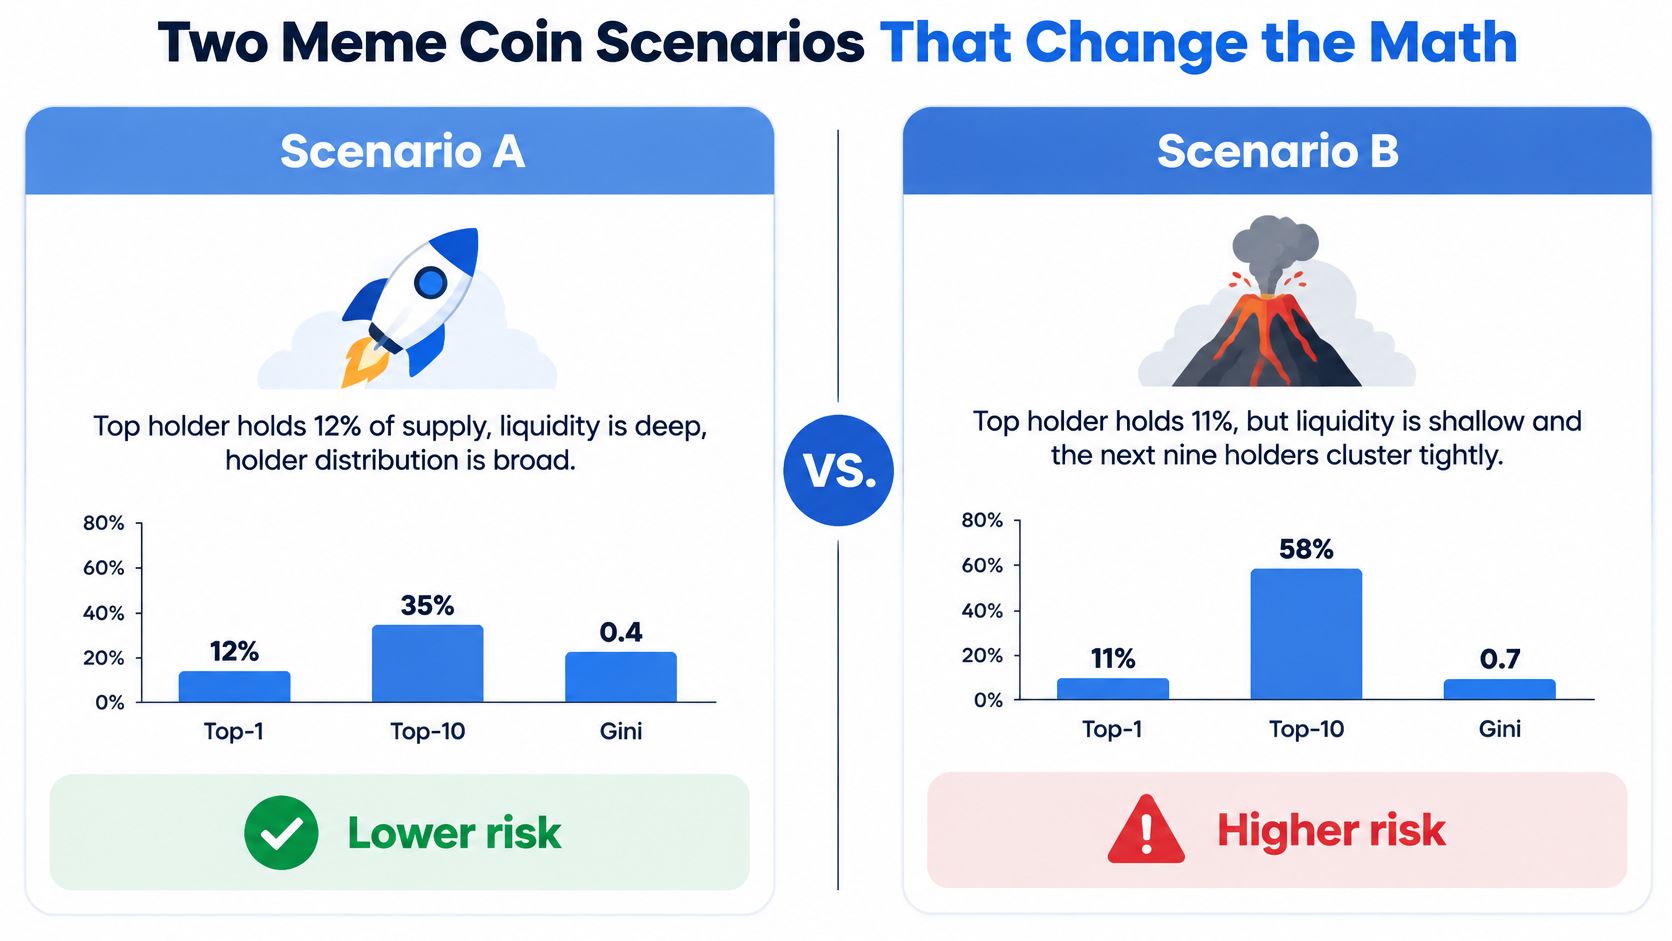
Two tokens can print nearly identical top-holder numbers and still be opposite trades. That surprises traders who treat a scanner's headline percentage as a verdict. The percentage is a surface. What matters is what sits underneath it: who funded those wallets, where the liquidity lives, and whether the crowd ahead of you can get out. The comparison below sets up the contrast before we walk through each one.
Scenario A Where a Larger Holder Is Workable
The top holder sits around 12% of supply. Liquidity is deep relative to typical trade size, the next holders show no shared funding source, and the deployer wallet no longer controls meaningful supply. You still respect the position, but a moderate entry with a defined exit makes sense because one seller can't easily trap everyone else.
Scenario B Where a Smaller Holder Is Dangerous
The top holder shows only about 7% of supply, which looks safer on a basic scanner. Look closer and four of the top 10 were funded from the same early buyer, liquidity sits in a single pool, and bundle activity spiked at launch. Counted accurately, that cluster is one large holder, and the pool can't absorb it.
This is the look-through problem. A distribution chart counts addresses. Risk counts decisions. Four wallets obeying one funding source behave like a single holder the moment sentiment turns, and a scanner that stops at address counts will never show you that. MemeAssist's holder-distribution evidence groups wallets by shared funding and flags single-pool liquidity, so the hidden cluster appears before you size in rather than after.
The short walkthrough below shows how quickly that kind of launch structure can form.
The same logic reaches far beyond meme coins. Bank for International Settlements guidance on third-party and provider dependence warns that concentrated relationships create correlated failure: when everyone leans on the same counterparty, one exit becomes everyone's exit. Token supply follows that pattern. Address counts flatter you. Behaviour tells the truth.
A low top-holder percentage is a starting condition, not a verdict. Scenario B fails on linkage and exit depth, not on its headline number.
A Practical Monitoring Workflow Before Every Buy
Run the check in a fixed order so you don't skip steps when a chart is moving. The sequence below moves from raw distribution to behaviour, because concentration only becomes dangerous once you know what holders have done and whether you can exit.
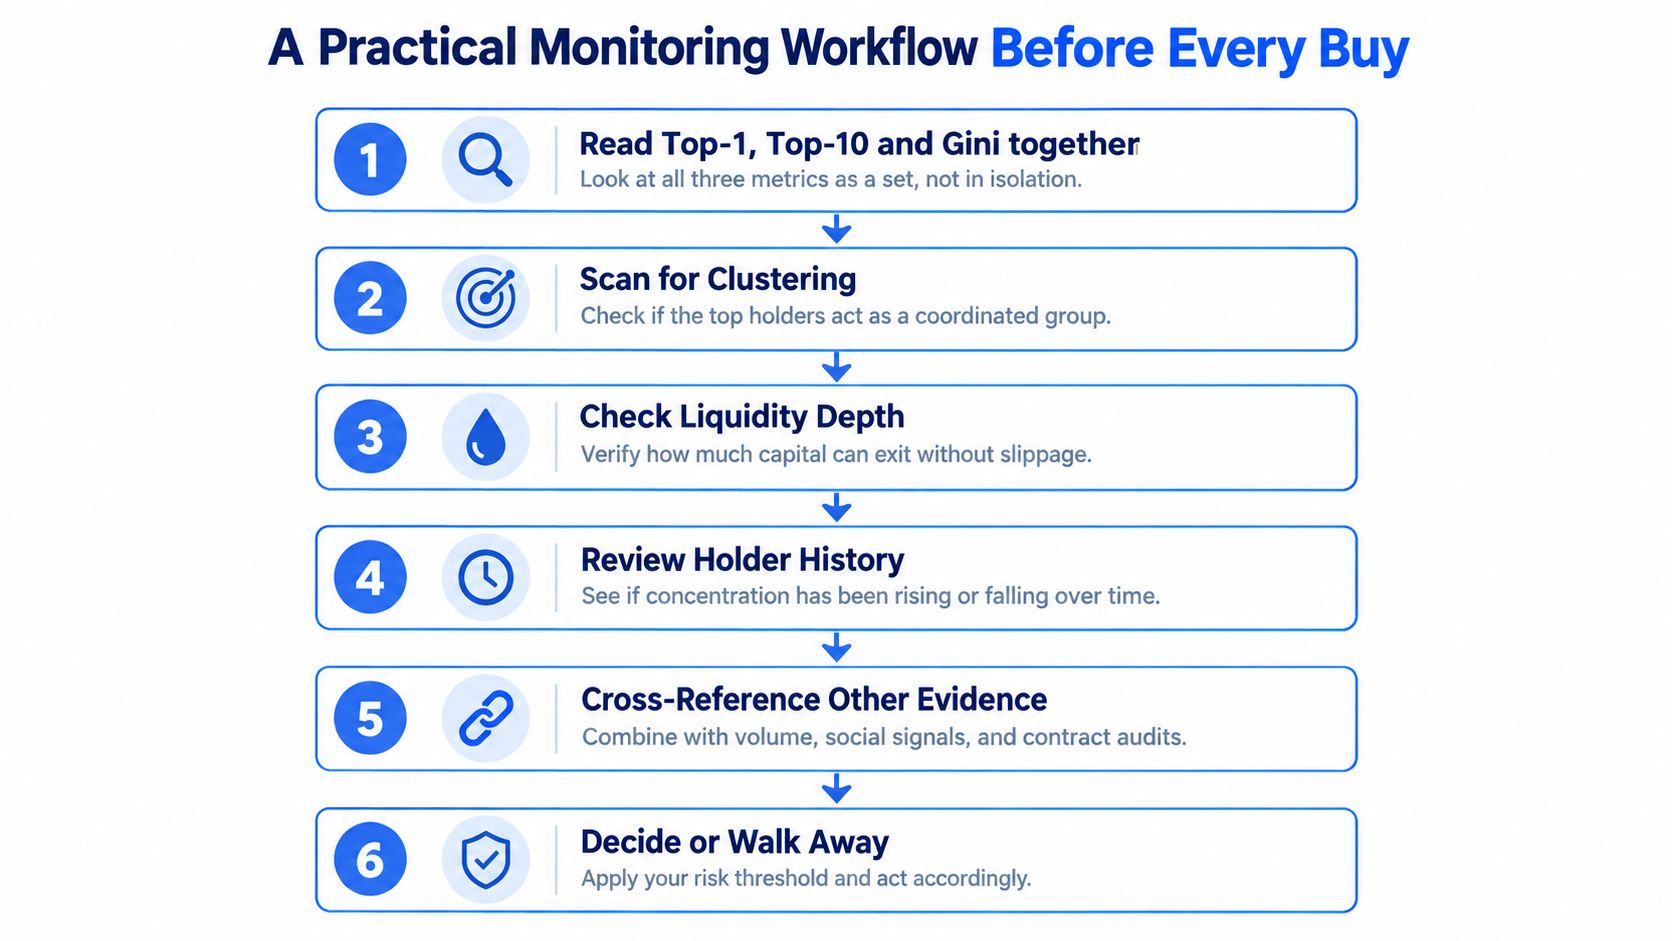
The Six Steps in Order
- Read top-1, top-10, and Gini together: Confirm the three views agree before trusting any one of them.
- Scan owner flags and exchange routing: Separate pool and exchange addresses from genuine holder risk.
- Check deployer and creator behaviour: Look for retained supply, recent transfers, and prior launches.
- Compare liquidity against holder size: Ask whether the largest cluster could sell without severe price impact.
- Look for bundle and insider patterns: Review early trades for coordinated buys in the first blocks.
- Run a stress case: Imagine the top cluster selling together or the main pool being withdrawn, then size accordingly.
A combined meme coin trade check helps you run these side by side instead of hopping between tabs. Skipping step five is the common failure. A clean distribution today means less if the launch pattern shows insiders already positioned to distribute into strength.
Keep it fast and repeatable. You're not writing a research report on every ticker. You're spending a short, disciplined check to avoid the trades where your exit depends on strangers choosing not to sell.
How MemeAssist Folds This Into a Solana Token Report
The workflow above maps onto six evidence categories in a MemeAssist report. Liquidity, holder distribution and concentration, creator behaviour, wallet activity, trading patterns including bundle and insider detection, and historical risk indicators are gathered live at run time. Each category answers one part of the question you've been building.
Holder distribution feeds the Overall Health Score and Rug Risk Rating. Creator and wallet activity catch the deployer-side version of concentration, where retained supply or linked wallets matter more than the public holder list. Trading patterns show whether early buyers behaved like independent traders or a coordinated group.
What You Actually See
The AI Verdict translates the combined evidence into plain language, so you read a judgement instead of stitching together raw metrics. The Detailed Risk Breakdown keeps the underlying checks visible for later review. A Trade Setup summary adds risk and opportunity context based on the observed signals.
- Overall Health Score: A single summary of the combined evidence.
- Rug Risk Rating: A focused read on exit and manipulation risk.
- AI Verdict: Plain-English interpretation of what the checks found.
- Detailed Risk Breakdown: The preserved evidence behind the scores.
Reports are computed from live on-chain and market data rather than cached snapshots, and no wallet connection is required. Flagged tokens are tracked for 24 hours, with outcomes fed back into the screening engine. Paste a Solana contract address, and the concentration questions from your manual workflow get answered in one report instead of six separate lookups.
Concentration Risk Questions Traders Keep Asking
How Can You Tell Whether Wallets Are Linked
Explorers show addresses, not relationships. You infer links from shared funding sources, synchronized buy timing, transfers between wallets, and repeated appearances across the same launches. No single clue proves coordination, but several together justify counting those wallets as one cluster.
When Is a High Holder Share Acceptable
Sometimes concentration is a deliberate choice. Deep liquidity, a short holding period, and a defined loss limit can make a larger holder tolerable, especially if that holder is a pool or exchange wallet rather than an insider. The 45% of surveyed professional investors who ranked reducing concentration risk or expanding into new markets as a top objective for 2025, reported in BNP Paribas Asset Management's Asia-Pacific investor survey, show this tension is normal even for professionals.
Does Being Right Cancel the Risk
No. Conviction addresses direction, while concentration addresses what happens if you're early, wrong, or slower than a large seller. You can be right about a narrative and still lose money because a linked cluster exited through shallow liquidity before the narrative played out.
Before your next Solana buy, run the token through MemeAssist to see holder concentration, liquidity, creator behaviour, and bundle signals in one live report with a plain-English verdict. It takes one contract address and no wallet connection, so you can check who really controls the supply before your capital joins it.