What Is Tokenomics? a Plain-English Guide for Meme Coins
Tokenomics is the economic design of a token: how it is created, how much of it exists, who holds it, what it is used for, and which incentives push people to buy, hold or sell. Bitcoin remains the cleanest benchmark, with a hard cap of 21 million BTC and a block reward that started at 50 BTC in January 2009 and had fallen to 3.125 BTC by the April 2024 halving.
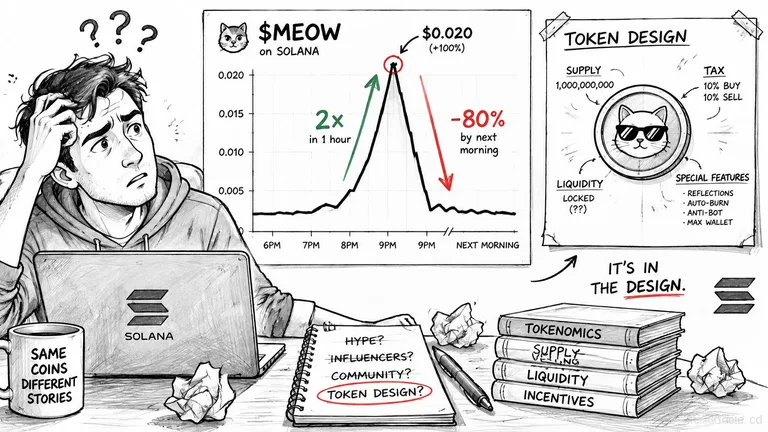
You're on a Solana token page at 2am, looking at a meme coin that doubled within the hour. The market cap looks tiny. The holder count is climbing. You buy, and by breakfast the chart is down 80%. Nothing on that page was a lie. The rules behind it were written before you arrived, and they decided who could sell, how fast, and what the price would do when they did.
That's what tokenomics is. It's also the part of a meme coin that almost nobody reads before buying.
Table of Contents
- Tokenomics Defined in Plain Language
- Key Terms Behind Every Token Page
- The Five Parts That Make Up Tokenomics
- How Supply Rules and Halvings Shape Scarcity
- Who Holds the Tokens and Why Concentration Matters
- How to Read a Meme Coin's Tokenomics Step by Step
- Limits of Tokenomics and Checking a Token Before You Buy
Tokenomics Defined in Plain Language
Watch the same pattern on any launchpad. A new Solana meme coin goes from nothing to a chart everyone screenshots, then gives back most of the move the next morning. The reflex is to blame hype or a bad entry. Usually the token's design did it: a small float, a few wallets holding most of what exists, and a liquidity pool shallow enough that one seller moves price.
The word is just token plus economics. Think of a village deciding how many notes to print, who gets the first batch, and what those notes will buy. A company analogy works too: tokenomics is the share structure and the payroll policy in one document, setting how many units exist, who receives them first, and what holders get for staying.
Tokenomics is not the price
The most common beginner mix-up is treating tokenomics as a synonym for price or market cap. Price is the outcome. Tokenomics is the rulebook that shapes supply and demand before the order book ever opens. A token can spike with terrible tokenomics and a good token can trade flat, because price reflects the last trade and tokenomics reflects the design.
For meme coins this matters more than anywhere else. There's often no product, no revenue and no roadmap to evaluate. Supply and holder structure become the only visible evidence you have. That's why two tokens can look identical on a chart and behave nothing alike when the first big seller arrives.
The version to remember: tokenomics answers who can sell, how much they can sell, how soon they can sell it, and who's left holding when they do.
Five moving parts do that work: supply, distribution, utility, liquidity and incentives. Each answers a different question, and together they turn a token page into a forecast.
Key Terms Behind Every Token Page
Token pages use the same handful of words in a slightly different order, so learn them once and the pages stop blurring together. Read them in the order you meet them.
| Term | Plain meaning | Why it matters |
|---|---|---|
| Circulating supply | Tokens tradable right now | Shows how much can be sold today |
| Maximum supply | Hard cap on all tokens ever created | Shows whether new tokens can be added |
| Fully diluted supply | Total supply including locked tokens | Shows future dilution risk |
| Minting authority | Right to create new tokens | Can raise supply at any time |
| Freeze authority | Right to block a wallet's transfers | Can stop holders from selling |
| Liquidity pool | Pooled tokens and base currency used for trades | Sets how easily holders can exit |
| Slippage | Gap between expected and received price | Shows the cost of a sale |
| Unlock date | Day locked tokens become sellable | Signals incoming sell pressure |
Two of these deserve extra care. Fully diluted supply answers a different question than circulating supply, because it counts tokens that don't exist in wallets yet but will. And mint or freeze authority still being active means the rules can change after you buy, which is a design flaw regardless of how good the chart looks.
Every term above maps to one of the five parts below. If a word on a token page still doesn't click, the MemeAssist glossary covers the vocabulary in plain language.
The Five Parts That Make Up Tokenomics
Tokenomics engineering is the design of a token's monetary and incentive system, and one analysis of token design and dilution frames it as supply policy, issuance, distribution, utility, staking, fees and burning working as a single system. The first technical decision is whether supply is capped or uncapped, because minting adds potential dilution while burning removes tokens from circulation.
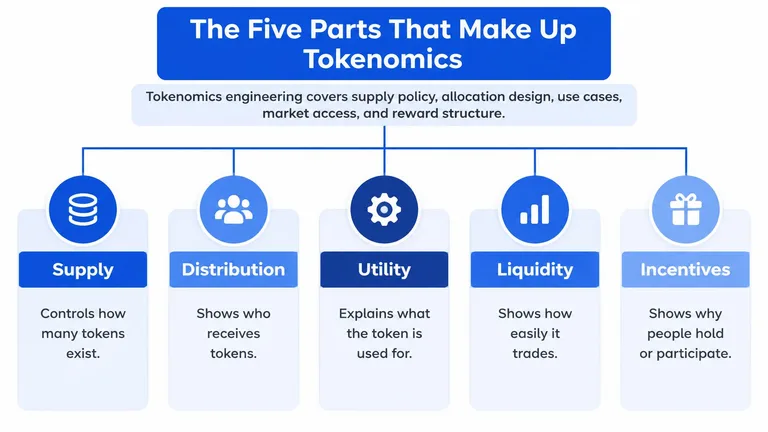
Here's how the five parts split the work.
| Component | Question it answers | What to check |
|---|---|---|
| Supply | How many tokens exist, and can more be created? | Maximum vs circulating supply, minting authority |
| Distribution | Who holds the tokens at launch? | Creator and insider wallets, top-holder share |
| Utility | What does the token actually do? | Fees, staking, access, governance, and whether that demand is real |
| Liquidity | Can holders sell, and at what cost? | Pool depth, lock status, slippage on a typical sale |
| Incentives | Which rewards push buying, holding or selling? | Emission rate, staking yield after inflation, unlock dates |
The parts interact, and that's where beginners lose the thread. Supply and distribution set the potential sell pressure. Utility and incentives decide whether demand can absorb it. Rewards can pull in users or validators, but when those rewards are funded by new tokens, value moves from existing holders to new ones unless usage grows fast enough to cover the gap.
A large fully diluted supply is also why a token can trade at a fraction of a cent and still be expensive. Multiply the unit price by every token that will exist and you get the number that matters, not the one on the ticker.
If you'd rather watch the framework before reading the checks, this walkthrough covers the same five parts.
How Supply Rules and Halvings Shape Scarcity
Bitcoin is the reference point because its rules were published up front and haven't changed. The Bitcoin supply and price reference at bitcoin.com fixes the maximum at 21 million BTC, with new coins entering circulation only as mining rewards that are cut in half every 210,000 blocks.
The whole schedule fits in one sentence. The block reward started at 50 BTC in January 2009 and had fallen to 3.125 BTC after the April 2024 halving, with the final bitcoin expected to be mined around 2140, according to the same bitcoin.com reference.
What a falling reward actually changes
Less new inventory per block, on a schedule everyone can see. Each halving shrinks the flow of new sellable coins, so the same demand meets a smaller supply of fresh tokens. That doesn't promise a price outcome, and treating the halving as a guaranteed pump is a common shortcut. What's predictable is the issuance rate, and predictable scarcity is easier for the market to price than a supply that can change without warning.
Apply the same test to a newer token
Copy the logic, not the numbers. Ask how many tokens exist, whether more can be created, and whether emissions dilute people who already hold. A token with open-ended minting needs a demand story strong enough to absorb everything the mint produces. If nobody can explain where that demand comes from, the mint is a countdown.
Staking rewards are a supply schedule in friendlier packaging. A working paper on staking tokenomics from the National Bureau of Economic Research models users splitting wealth between on-platform activity and staking, and notes that increased staking can reduce the reward rate for a given reward pool because more participants share the same emissions. Cross-sectionally, higher staking ratios correlate with higher reward rates; over time, the same pool gets split further.
Practical rule: Compare the advertised yield with the mint rate. If a token pays 40% while emitting 60% new supply, the yield is a transfer, not income.
Predictable, capped issuance is the benchmark. Open-ended minting is a question mark that has to be answered with real usage, not a percentage on a landing page.
Who Holds the Tokens and Why Concentration Matters
Ethereum's launch is the best documented case of distribution shaping everything downstream. At genesis in July 2015, 60 million ETH, reported as approximately 50% of the then-current supply, went to participants in the initial coin offering, while another 12 million ETH went to the Ethereum Foundation and early contributors, per Galaxy Research's breakdown of Ethereum supply distribution.
The network then issued more ETH through proof-of-work mining and later through proof-of-stake validation. When fee handling changed in 2021, roughly 2.4 million ETH, around 2% of supply, had been removed from circulation by June 2022.
Stated supply versus sellable supply
Those two facts point in opposite directions, and both are normal. A token can advertise a huge total supply while only a thin slice circulates, which means a wave of dilution arrives when locked allocations are released. Fee burning does the reverse and shrinks supply, though only as much as network usage allows.
For meme coins, the concentration side of that ledger usually decides the outcome. Creator holdings, insider wallets, liquidity ownership, vesting schedules and the share controlled by the largest addresses tell you more than market cap does. A fair launch label and a zero tax label describe how a token was sold, not how widely it ended up distributed.
A token can look broadly held on the surface and still be controlled by wallets that coordinated before anyone else clicked buy.
A worked example
Say a token launches with 1 billion units. The creator wallet holds 30%, the top ten wallets hold 60% including a few addresses funded from the same source at launch, and the pool holds a thin remainder. Market cap reads modestly and the chart looks calm. Now price the exit: a handful of decisions by a handful of people set what everyone else receives.
That's why holder concentration deserves its own check rather than a footnote. The guide to top-holder concentration as a rug signal walks through how to read those clusters without panicking at every large wallet.
How to Read a Meme Coin's Tokenomics Step by Step
Most tokenomics explainers stop at a checklist, as if supply, utility and burns were static facts. An analysis of memecoin ownership and exit liquidity argues the better question is dynamic: who can sell, how quickly, and what happens to price when they do. Work through these six steps in order.
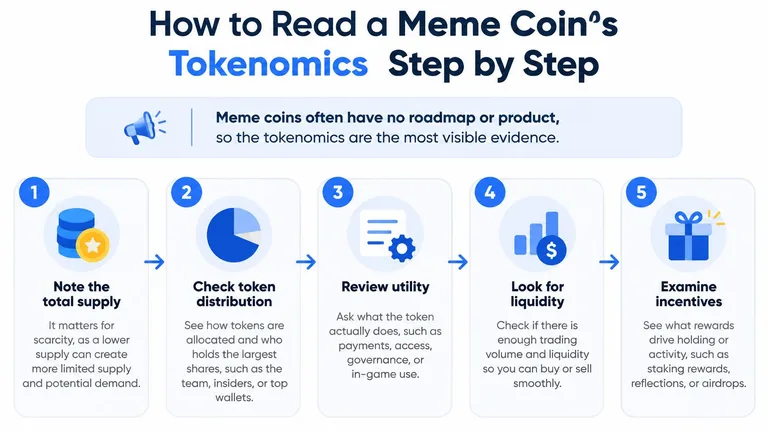
- Read both supply numbers. Total supply and circulating supply. If only a sliver circulates, most of the token is queued up behind a future release you can't see yet.
- Check mint and freeze authority. Live mint authority means supply can grow at any moment. Live freeze authority means your wallet can be stopped from sending, which turns a position into a hostage.
- Trace the creator and insider wallets. Include addresses funded from the same wallet around launch, since those often belong to the same person running several positions.
- Add up the top ten holders, excluding pools. Remove the liquidity pool accounts first, otherwise the percentage is meaningless. What's left is the group that can move price.
- Measure exit depth. Look at pool size, whether liquidity is locked, and the slippage you'd pay to sell the size you hold. A pool that absorbs your sale without a dent is a real exit; one that doesn't is a trap door.
- Ask who exits first. The earliest buyers hold the cheapest coins and have the most to gain from selling into your buy.
What the data looks like when it's bad
Early buyers on Pump.fun can accumulate substantial positions during a launch and later sell into decentralized-exchange liquidity, draining base assets and producing sharp price declines, the same study found. It also examined 385 meme tokens and found the top 10 holders controlled an average of 77.85% and a median of 87.01% of supply in the concentrated group.
Read those two numbers together and the "community-owned" story collapses. Ownership that lopsided isn't distributed, it's staged.
So write one sentence before you buy: this is who can sell, this is how fast they can do it, and this is what the pool can absorb. If you can't finish the sentence, you don't have a thesis yet.
Limits of Tokenomics and Checking a Token Before You Buy
Three assumptions do the most damage. A low unit price means cheap. A large supply means bad. A tidy tokenomics page means safe. None of them hold, and the third one fails hardest, because design tells you what's possible, not what's happening.
Volume is where that gap opens. Research on artificial growth in meme tokens found that 82.6% of high-return meme tokens in its sample showed evidence of extensive artificial-growth strategies built to create a misleading appearance of market interest, and it identified wash trading, where participants buy and sell without taking meaningful market risk, alongside heavy ownership concentration.
So check behavior, not just structure. Trade-size distribution, the same wallet pairs appearing repeatedly on both sides, buys and sells landing in synchronized bursts, and net liquidity changes across the day separate organic interest from choreography.
Price swings drain the crowd too. A 2024 study in the International Journal of Financial Studies analyzed 58 blockchain tokens and found that a 10% increase in price volatility was associated with a 3.96% to 5.88% decrease in active addresses on average.
That's where our work fits. MemeAssist examines token supply distribution, including concentration and possible wallet connections, and folds it into a wider Solana token safety check that reads creator behavior, liquidity and trading patterns together. We built it as a second opinion for research, not a guarantee that a token is safe: a token can pass our checks and still collapse because demand disappears, large holders sell, liquidity changes or new information appears.
If you want a second read on a token before you size a position, MemeAssist turns supply distribution, holder concentration, creator behavior and liquidity into one explained Solana report with a health score, rug risk rating and plain-English verdict. Run the address you're about to buy and compare its exit structure against the five parts above, so the question stops being whether the chart looks cheap and becomes who can sell before you do.
Topics: what is tokenomics, tokenomics, meme coin tokenomics, token supply, Solana meme coins
Informational only, not financial advice. Meme coins are extremely high-risk.
All articles