What Is Wash Trading? the Solana Trader's Complete Guide
What Is Wash Trading. Learn what wash trading is, how it manipulates Solana meme coins, and how to detect and avoid artificial volume using real on-chain
Published
Updated
You can spot the pattern before you can name it. A new Solana meme coin is climbing a trending list, the chart looks alive, and every room is full of people posting screenshots of fast gains. Then you open the wallet flow and the story changes, the trades look repetitive, the same sizes keep printing, and the holder count barely moves while the feed screams momentum.
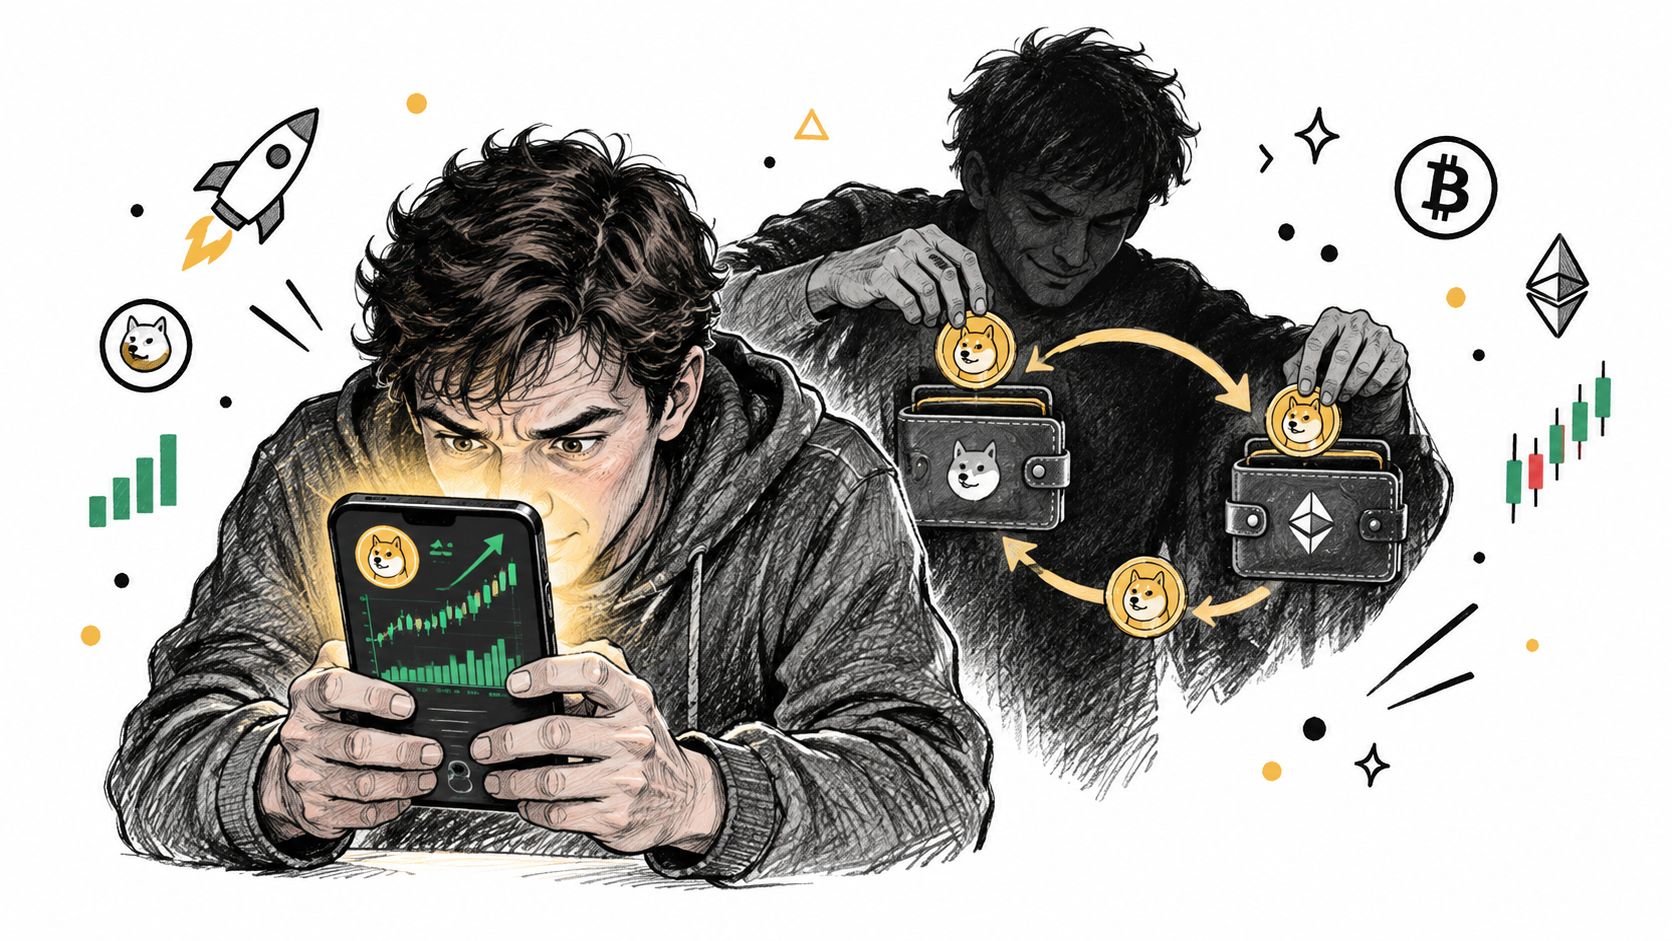
That gap between apparent activity and real participation is the whole problem. Wash trading is when the same person, or coordinated parties, buy and sell the same asset to create the appearance of genuine market activity without materially changing ownership, position, or exposure. In practice, that means the tape can look busy while the market underneath stays thin and fragile.
On pump.fun, that distinction matters more than most traders want to admit. Research on Pump.fun launches found only 0.198% reached graduation during a 24-hour observation window in one large sample, which says a lot about how rare durable momentum is compared with manufactured hype.[^1] If a token looks hot but the wallet behavior feels recycled, the right question isn't “how hard is it pumping?” It's “who is buying?”
Table of Contents
- The Pump You See and the Reality Behind It
- What Wash Trading Actually Is
- How Wash Trading Appears on Solana
- How Wash Trading Distorts Token Risk
- Detection Signals Every Solana Trader Should Watch
- How MemeAssist Surfaces Wash Trading Evidence
The Pump You See and the Reality Behind It
A token can look unstoppable for an hour and still be dead on arrival. On Solana, that happens all the time, a new launch gets traction, buy orders stack up, and momentum traders pile in because the screen says volume is real. But when the same wallets keep appearing, the same trade sizes repeat, and the holder base doesn't broaden, the “market” is often just a loop.
Volume can be a costume
Wash trading exists because volume is persuasive. People, bots, and ranking systems use volume as a shorthand for legitimacy, so fake activity can buy attention long before anyone checks whether independent buyers are involved. That's why a chart can scream strength while the market is being staged.
Practical rule: if volume is rising but unique participation isn't, treat the move as suspect until proven otherwise.
The pain point for traders is obvious. A token with manufactured activity can look liquid enough to enter, then turn illiquid the moment the controlling wallets stop recycling orders. That's where people get trapped, they buy into the illusion of demand and discover too late that exit liquidity never really existed.
The uncomfortable part is that this doesn't always look like blatant fraud from the outside. On-chain, the trades settle normally, prices may move plausibly, and the feed still fills with green candles. The only reliable defense is to check whether the activity is independently generated or just being recycled among linked wallets.
Why the 24-hour window matters
The 24-hour graduation bottleneck on pump.fun is a useful reality check because it separates noise from persistence. If a token's activity is mostly manufactured, the momentum tends to fade when the engineered flow stops, while authentic shared demand leaves behind broader wallet participation and more believable holding behavior. That's the difference between a crowd and a choreography.
The best habit is simple. Don't ask whether a token is moving, ask whether the movement is being created by actual buyers or by the same supply rotating through a small set of wallets. That one distinction saves a lot of bad entries.
What Wash Trading Actually Is
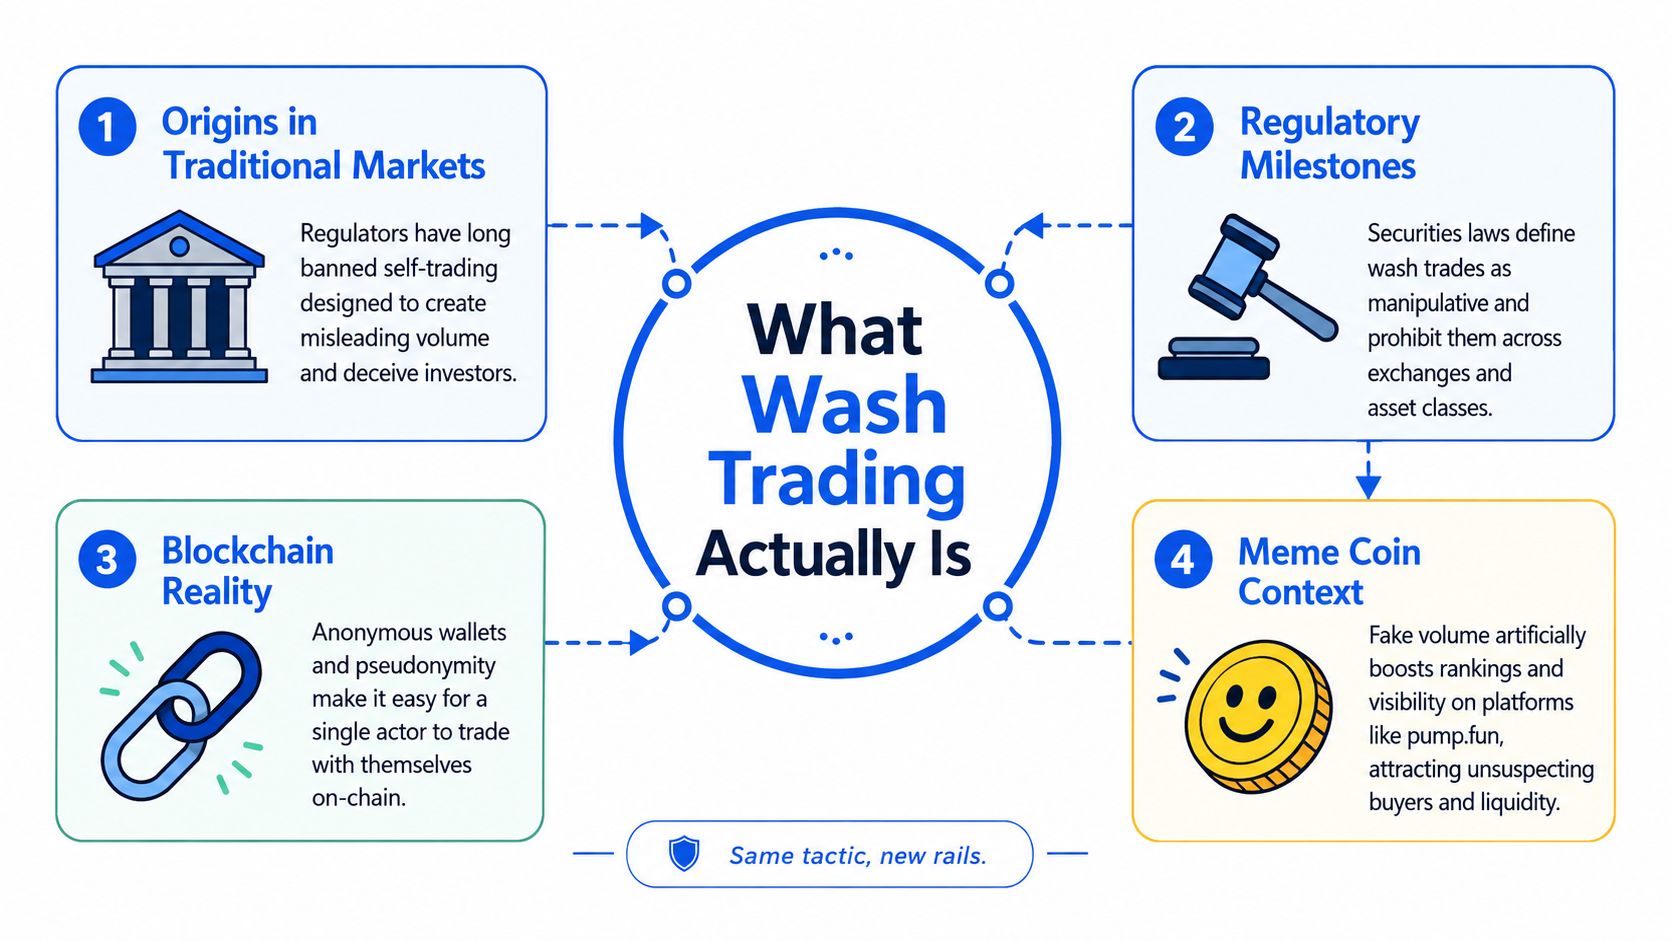
Wash trading is a market manipulation tactic, not just a suspicious chart pattern. The U.S. Commodity Exchange Act describes it as transactions entered into, or purportedly entered into, to give the appearance that purchases and sales occurred without incurring market risk or changing the trader's market position. In plain English, someone is manufacturing the look of trading without taking a real directional bet.
The mechanics are straightforward. A trader, or a coordinated group, buys and sells the same asset at nearly the same time so that reported volume goes up while net ownership barely changes. That creates fake evidence of liquidity, demand, and market participation, which can mislead other traders into treating the asset as healthier than it is.
The SEC example shows the pattern clearly
A 2014 SEC enforcement action alleged that an equity-research-firm owner conducted approximately 100 wash trades over nearly one year, with buy and sell orders placed within 90 seconds of each other and using virtually identical prices and quantities.[^2] The point wasn't hidden complexity. It was repetitive, near-simultaneous trading designed to make a thinly traded stock look active.
For Solana traders, that matters because the same basic structure can happen on-chain with fewer barriers. Anonymous or pseudonymous wallets make it easier to mask control across multiple accounts, and the market only sees the printed trades, not the intent behind them. A token can be “busy” without being healthy.
What it is not
Wash trading isn't the same thing as normal liquidity provision or active trading. Legitimate market activity changes who holds the asset, who carries the risk, and how much real interest exists on each side of the market. Wash trades, by contrast, are economically self-canceling.
A real market prints evidence of disagreement between buyers and sellers. A wash trade prints the illusion of that disagreement while leaving the economics mostly unchanged.
That distinction matters when you're looking at meme coins, because some tokens have real liquidity and real risk even if the wash pattern isn't obvious. Others look active only because a small set of wallets keeps ping-ponging the supply. The chart alone won't tell you which one you're seeing.
How Wash Trading Appears on Solana
On Solana, wash trading usually shows up as a pattern, not a single smoking gun. One wallet with high turnover doesn't prove manipulation. The stronger signal comes from linked wallets, recurring counterparties, synchronized timing, and trades that leave each participant with little or no net position change.
The graph tells the story
Researchers studying decentralized exchanges have used graph-and-balance methods to detect wash trading by finding strongly connected components of potentially colluding accounts, then checking whether a time-bounded trade set leaves each participant's token and cash position unchanged.[^3] That approach is useful on Solana because it matches what suspicious meme-coin flows often look like in practice, repeated offsetting transfers, circular routes, rapid buy-sell cycles, and minimal inventory change.
The key is to stop staring at one line item and start looking at relationships. If the same wallets keep appearing as both buyers and sellers, and the timing is tightly compressed, the activity starts to look manufactured rather than organic. That's especially true when those wallets are behaving like a closed loop instead of a broad market.
Practical rule: a token with many trades but few truly independent participants deserves more skepticism than a token with modest volume and broad wallet dispersion.
A useful internal check is to compare the visible volume with holder behavior. If volume is exploding but the set of active, unique traders stays narrow, the apparent market depth may be fake. If the same token also shows repetitive wallet clusters near launch, the odds of engineered activity go up fast.
For traders who want a glossary-level reference on linked activity, the concept of bundled wallets is a helpful adjacent signal, because it often travels with wash-style behavior on launchpads and DEXs.bundled-wallets
What the research says about scale
That detection work on decentralized exchanges found at least $159 million in wash-trading volume, with more than 30% of traded tokens showing wash-trading activity and approximately 10% of EtherDelta tokens almost exclusively wash traded.[^3] Those numbers don't mean every Solana token is manipulated, but they do show that this isn't a fringe issue or an academic edge case. It's a recurring market structure problem.
The practical takeaway is simple. If the wallet graph looks circular, the trade timing is too neat, and net ownership barely changes, don't let raw volume talk you into ignoring the rest of the tape.
How Wash Trading Distorts Token Risk
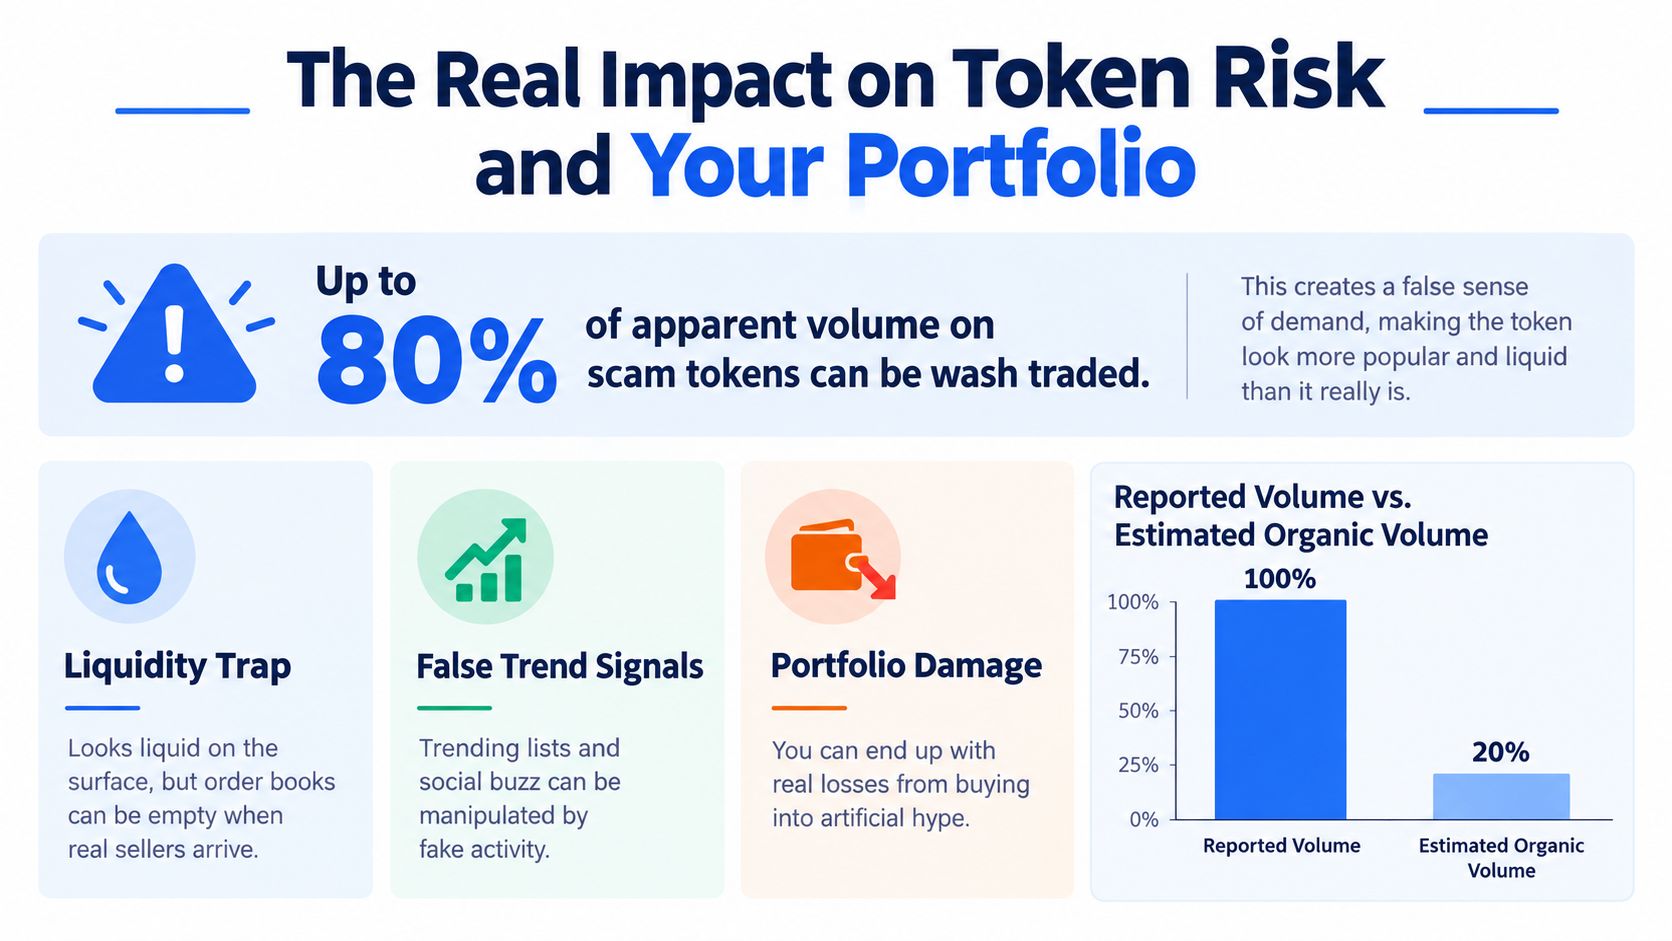
A National Bureau of Economic Research study found that wash trading averaged more than 70% of reported volume on unregulated cryptocurrency exchanges, with fabricated volume reaching trillions of dollars annually. It also found that manipulated volume improved exchange rankings and temporarily distorted prices.[^4] On Solana, that matters because ranking and visibility shape what traders see first, and that changes what people buy and when they buy it.
Artificial liquidity is the trap
Fake volume does more than pad a chart. It can pull in real traders who assume the book has enough depth to enter and exit cleanly. When the wallets supporting that flow stop trading, the market looks much thinner than it did a minute earlier.
The bigger issue is signal quality. Wash trading tells you the market may be exaggerating itself, but it does not, by itself, prove a rug pull. A token can still have independent liquidity, and a token with no obvious wash pattern can still carry serious risk through concentrated ownership, creator-linked wallets, mint authority, or removable liquidity.
That distortion is especially painful in meme coin trading. A token can get pushed higher on lists, look alive in social channels, and attract bots that use turnover or volume as an entry trigger. Once those buyers arrive, the chart can keep moving for reasons that have little to do with healthy market structure.
The practical breakdown looks like this:
- Reported volume can be inflated without real demand.
- Apparent liquidity can vanish when the engineered trades stop.
- Price action can look strong even when ownership has not widened.
The token that looks easiest to trade is often the one that becomes hardest to exit.
For Solana meme coins, a wash-trading flag belongs in a wider risk check. It points to the quality of the market signal, while other checks still need to cover contract risk, holder concentration, and creator control before you size a position.
Detection Signals Every Solana Trader Should Watch
A token can look busy and still be staged. On Solana, that matters because meme coin launches move fast, and the chart can reward bad assumptions before anyone has time to verify the flow behind it. Wash trading studies keep that warning in perspective, with a Yale Cowles analysis estimating it at 77.5% of total volume across unregulated cryptocurrency exchanges, and a separate 2023 study flagging 968,472 wash trades on Blur, or 26.94% of the sample, and 118,055 on LooksRare, or 29.42%.[^5]
Compare the signals, not just the chart
The patterns that matter usually show up together:
- Repeated same-size trades that look automated instead of discretionary.
- Circular wallet flow where tokens move through a small linked set of addresses.
- Burst activity in a single slot or block, especially when the same counterparties keep coming back.
- High turnover with few unique traders, which means the market is narrower than it appears.
- Minimal net movement in ownership, even while the tape looks active.
One of these can happen in a normal launch. Several of them at once point to manufactured activity. That is the practical difference traders need to watch for, because a busy chart alone does not tell you whether real buyers are building a position or the same wallets are recycling volume.
What tools should surface
A useful risk screen should show wallet links, bundled trading, creator behavior, and whether visible volume matches independent participation. It should also make the current path of the token easy to inspect, not just drop a label on top of it. For a full walkthrough of these checks, see how to detect wash trading on Solana. MemeAssist's Solana token analyzer does that by combining live on-chain and market data into a token-level risk report, so you are not rebuilding the graph by hand.
The method matters more than the brand name. Static snapshots can miss fast launch activity, while live analysis can catch the same wallet clusters and timing patterns that often appear when volume is being staged.
Practical rule: do not trust volume until you have checked whether the same wallets are doing too much of the work.
For meme coins, compare broad, independent participation against recycled activity. That is what separates a tradable market from a staged one.
How MemeAssist Surfaces Wash Trading Evidence
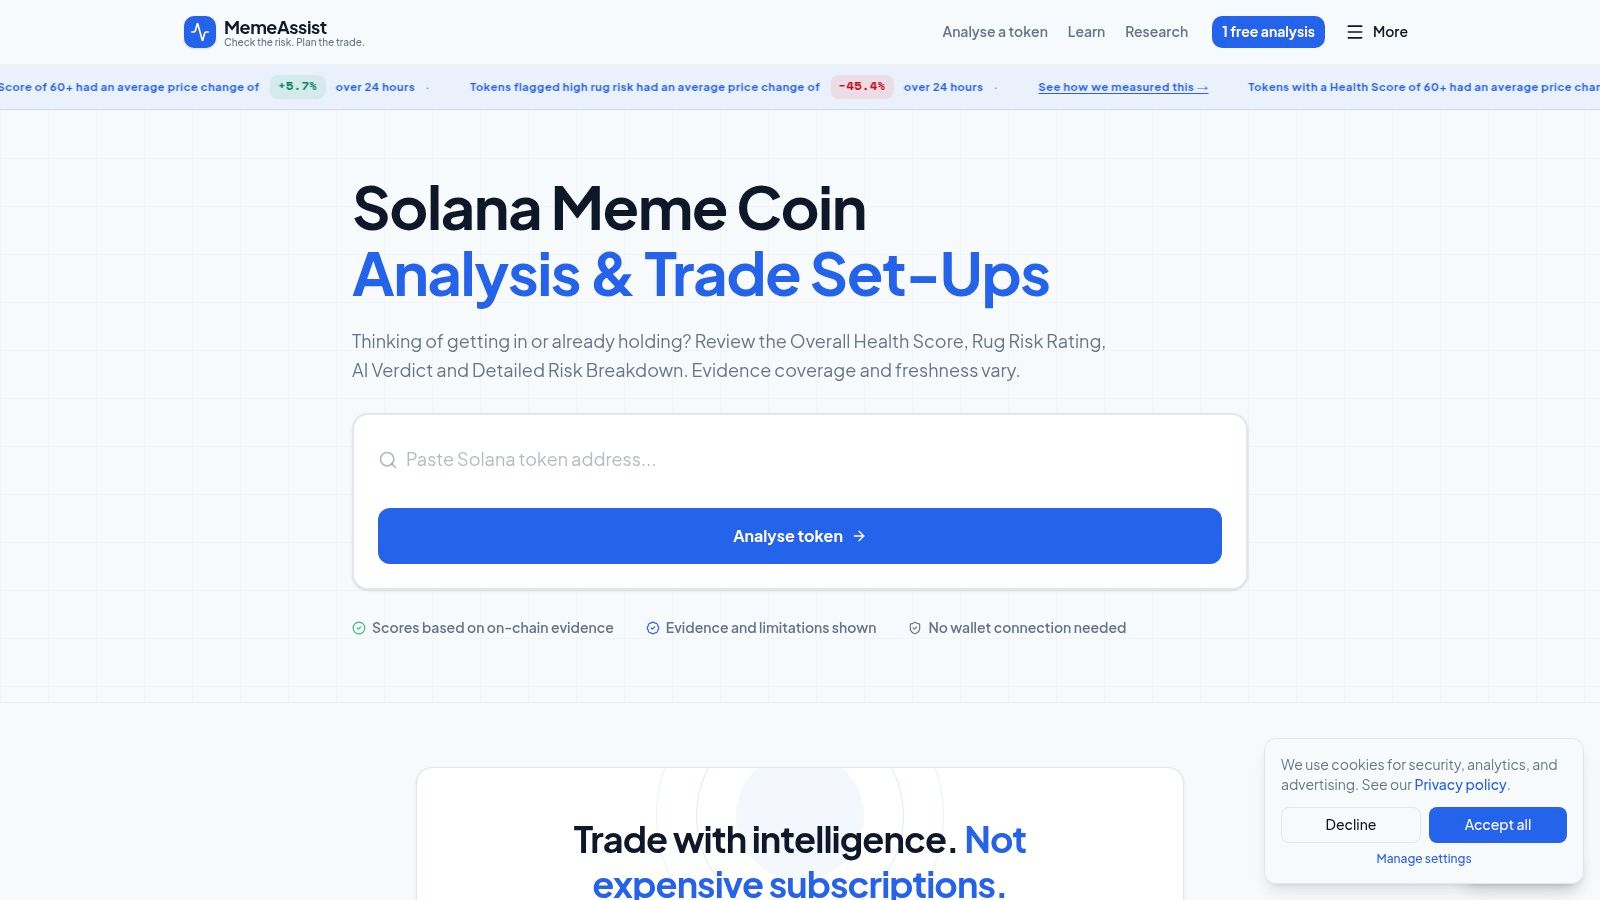
Manual tracing works for one token if you've got time and patience. It breaks down fast when launches are moving every few minutes. That's why on-demand analysis matters, because the useful output is not just a red flag, it's a current read on what the wallets, liquidity, and trade patterns are doing right now.
What the report needs to show
A serious token screen should bring together liquidity, holder distribution, creator behavior, wallet activity, trading patterns, and historical risk indicators in one place. MemeAssist does that with live on-chain and market data, then turns the findings into an Overall Health Score, a Rug Risk Rating, a plain-English AI Verdict, and a Detailed Risk Breakdown. That mix is useful because wash trading rarely matters alone, it matters in context.
The strongest part of the workflow is that the analysis is computed at the moment you run it, not pulled from a stale snapshot. That matters on Solana, where launch activity can change fast and yesterday's read can already be outdated by the time you click through. If you're checking a token after a burst of activity, live data is the only version that really counts.
What to do with the output
Use the report as a decision filter, not a guarantee. If the trading pattern looks circular, the wallet clusters are tight, and the volume isn't supported by broader participation, you've got enough reason to slow down or pass. If the pattern looks cleaner but other risks are still present, like concentration or creator-linked behavior, then the absence of wash trading doesn't make the token safe.
The platform also tracks flagged tokens over 24 hours, which helps separate suspicious activity that later proves harmless from suspicious activity that precedes a real problem. That feedback loop matters because good risk tooling should improve after it sees how outcomes unfold.
If you want a fast way to check whether a Solana token's volume is real or staged, use the live analyzer, read the wallet behavior, and treat the result like a trade filter, not a vibe check.
Wash trading only gets dangerous when you mistake it for demand. Run the token through MemeAssist, check the live wallet and liquidity evidence, and use the report to separate real participation from manufactured volume before you size the trade.
[^1]: Brave New Coin coverage of Pump.fun graduation data [^2]: SEC press release on the 2014 wash-trading enforcement action [^3]: Graph-and-balance wash-trading research on decentralized exchanges [^4]: NBER paper on wash trading in cryptocurrency exchanges [^5]: Yale Cowles study on crypto wash trading