Why Is Liquidity Important for Solana Meme Coins
Why Is Liquidity Important. Understand why liquidity matters for Solana meme coins. Learn how to spot rug pulls, read pool depth, and avoid exit traps before
Published
Updated

Liquidity determines whether you can sell a Solana meme coin at a reasonable price during stress. During the 2008 crisis, repo funding fell from approximately $3.70 trillion to $2.59 trillion, a 30% decline, showing how quickly financing and market capacity can contract when confidence disappears.
You buy during the green candles because the chart looks unstoppable. The pool appears active, trades keep printing, and every dip gets bought. Then momentum turns. Your sell order goes through, but the output is far below the displayed price, or the transaction fails because the market can't absorb your position without severe slippage.
That isn't just bad timing. It's liquidity risk. On Solana, a token can look popular while offering very little usable depth for a real exit. The number that matters isn't only how much value appears in a pool. It's how much of that value remains available when other holders are trying to sell too.
Table of Contents
- Why Liquidity Determines Your Exit Ability
- What Liquidity Actually Protects
- Traditional Markets Versus Meme Coins
- Liquidity Metrics That Actually Matter
- How Illiquid Markets Enable Rug Pulls
- Practical Liquidity Checks Before You Trade
- Liquidity as Risk Management
Why Liquidity Determines Your Exit Ability
Liquidity is the market's ability to absorb buying and selling without forcing the price sharply away from the quoted level. In practical terms, it answers a simple question: if you need out now, can someone take the other side without making you pay for your urgency?
Suppose you buy a meme coin after a fast pump. The chart shows a price that seems easy to enter, but the pool contains limited reserves and most recent activity came from small purchases. When you try to sell a larger position, the automated market maker moves along its pricing curve. Each part of your order receives a worse price than the part before it.
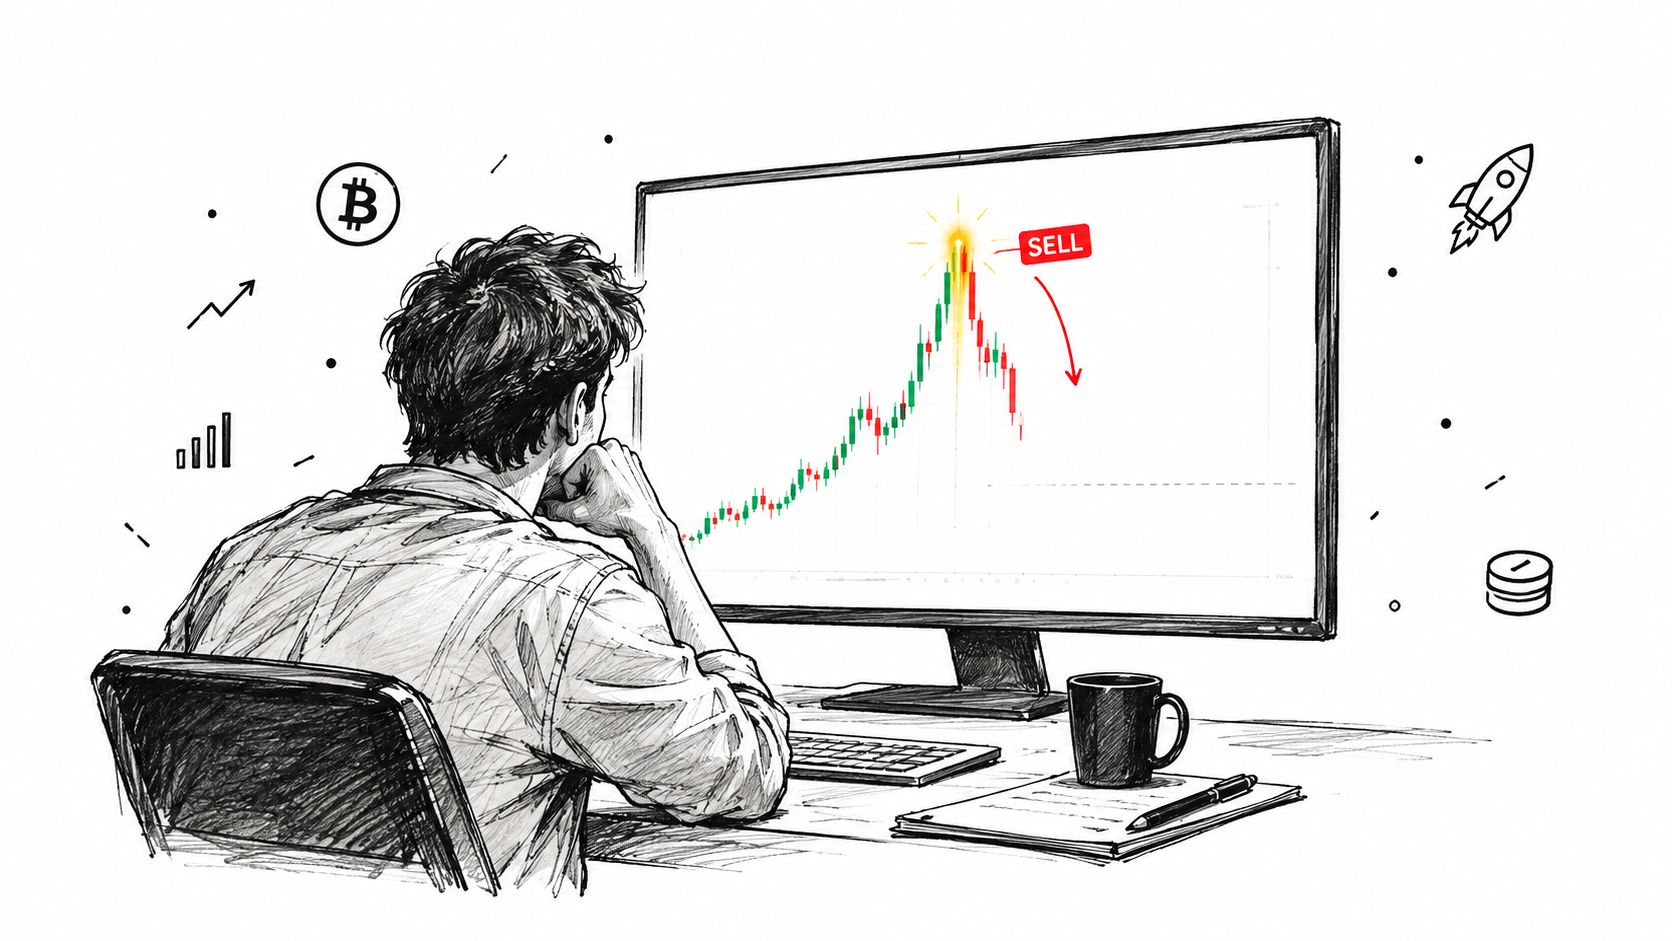
Liquidity is more than volume
Volume tells you that trades occurred. Liquidity tells you whether your trade can occur at a price you can reasonably accept. A token may record busy activity while still having shallow reserves, concentrated liquidity, or a buyer base that disappears as soon as the narrative weakens.
That distinction matters because liquidity supports both trading and financing. The Minneapolis Fed's historical discussion of liquidity crises shows that assets can become difficult or expensive to finance when lenders stop renewing short-term agreements. The same principle appears in a smaller, faster form on meme-coin pools. When confidence breaks, buyers retreat, liquidity providers withdraw, and sellers compete for a shrinking exit.
Practical rule: Treat liquidity as the capacity to execute under pressure, not as a decorative number beside the token price.
For a trader, this changes the core question from “Can I buy this?” to “Can I sell this after several other wallets try to sell first?” That is why liquidity is a risk-detection variable. It reveals how fragile the token's market may be before the chart makes the weakness obvious.
What Liquidity Actually Protects
Liquidity protects more than the final sale price. It helps control spreads, slippage, financing costs, and price discovery, meaning the process by which trades produce a believable market price. When depth is available, buyers and sellers can transact near quoted prices. When depth thins out, even modest orders can move the market and make the displayed price unreliable.
The U.S. repo market offers a useful warning. Repo volume among primary dealers averaged about $52 billion in 1994 and climbed to just under $200 billion during the 2000s, yet the larger market still failed to remain resilient during the financial crisis. Scale created capacity in normal conditions, but it didn't guarantee that funding providers would continue to participate during stress. The Federal Reserve analysis of repo-market liquidity also estimated that a $100 billion increase in net Treasury issuance pushed the repo rate upward by about 4 basis points, linking collateral supply and funding demand directly to borrowing costs.
The two jobs of liquidity
Liquidity performs two related jobs:
- Execution: It lets you trade near the visible price instead of paying a large spread or suffering severe price impact.
- Resilience: It gives the market enough depth to absorb forced selling without turning every exit into a cascade.
A meme coin pool doesn't have a central dealer promising to make a market. It relies on available reserves, liquidity-provider incentives, arbitrageurs, and willing buyers. If those participants step away together, the quoted price can remain visible while the executable price moves dramatically.
Liquidity also evaporates faster than it rebuilds. A trader can remove a position in seconds, a provider can withdraw or shift liquidity, and a coordinated group can sell into the same narrow pool. Rebuilding confidence requires new buyers, fresh capital, and a reason to transact.
The historical lesson isn't that Solana pools behave exactly like repo markets. The lesson is that a large market snapshot doesn't prove stress capacity. Funding and participation are behavioral. Once participants decide that the risk is too high, the market you thought you owned can become a market you can't leave.
Traditional Markets Versus Meme Coins
A Solana meme coin can look tradable on entry and become impossible to exit after one provider changes position. Traditional equity and foreign-exchange markets usually spread orders across venues, dealers, and many participants. Their depth can weaken gradually, giving traders more time to adjust. A thin meme-coin pool can change character within a single block.
The Federal Reserve's research on liquidity and price discovery describes the broader principle: deeper liquidity generally supports smoother execution, while shallow liquidity makes large orders and sudden selling more disruptive. Automated market makers apply that principle mechanically. The pool does not judge whether your sale is reasonable. It reprices the remaining reserves according to the trade.
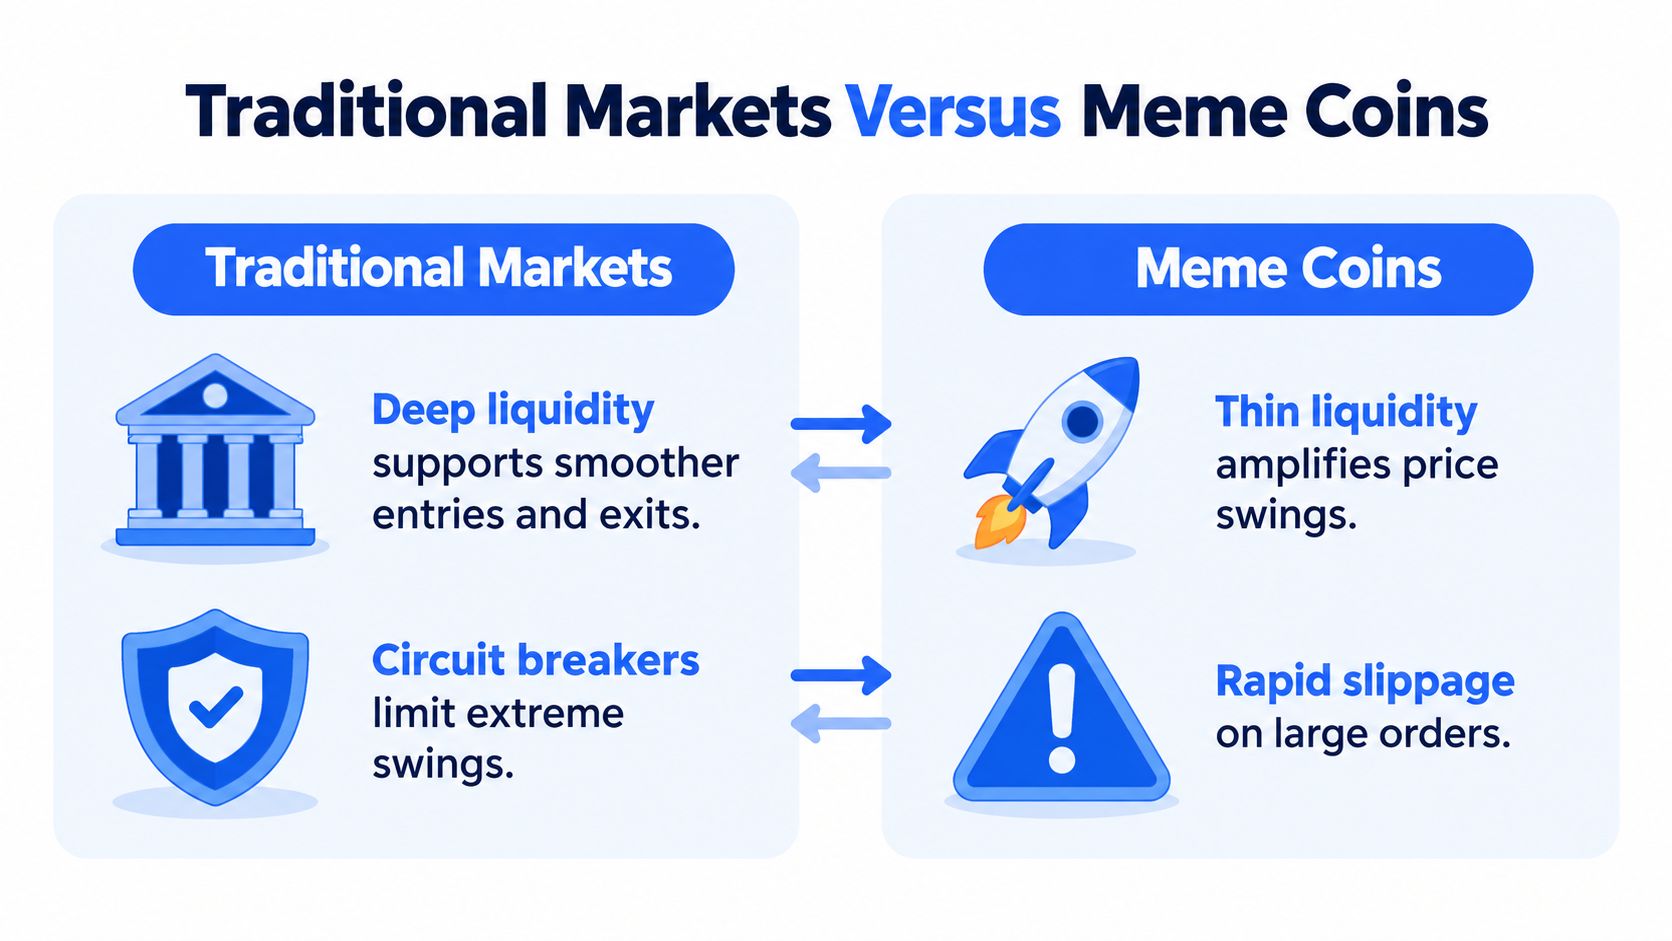
A conditional resource
Traditional-market liquidity often draws support from multiple venues, professional intermediaries, and established trading systems. Meme-coin liquidity may sit in one pool or depend on a small group of providers. That concentration turns provider behavior into an exit-risk signal. A buyer who barely moves the price can become a price-moving seller later.
| Market characteristic | Traditional markets | Solana meme coins |
|---|---|---|
| Depth | Often distributed across many participants and venues | May depend heavily on one pool or a small provider set |
| Price impact | Usually more predictable at ordinary sizes | Can accelerate sharply as reserves are removed |
| Provider concentration | Several intermediaries may share market-making activity | One provider can control a meaningful share of usable reserves |
| Pool composition | Orders draw on liquidity across venues and instruments | A token pair can become one-sided after concentrated buying or selling |
A single provider removing 60% of pool reserves can take usable exit depth near zero within one block. The percentage is a practical example of why provider concentration deserves the same attention as the displayed liquidity figure. Check whether liquidity is locked or removable, whether the paired asset remains substantial, and whether the pool has changed sharply during recent trading.
Market capitalization creates another trap. It reflects the token's implied value at a quoted price, not the cash available for every holder to sell. A token can show a large market cap while offering little immediately usable liquidity. If holders seek the same exit, reserves determine the amount sellers receive.
A liquidity snapshot is a starting point. It is not a promise that the same depth will exist when you need it.
Treat meme-coin liquidity as conditional. Review the pool's composition, provider behavior, spread fragility, and recent volume before taking a position. Tools such as MemeAssist can organize that due diligence, but the trade decision still depends on whether the pool can support your exit.
Liquidity Metrics That Actually Matter
A single liquidity figure can't tell you whether a position is safe to enter. Start with pool depth, then compare it with your expected position size and the trade sizes already moving through the pool. The practical objective is to estimate how much your own order, and a later exit, would disturb the reserves.
Read the pool, not just the headline
Check the paired assets and their ratio. A pool containing a volatile token against a major Solana asset can change composition quickly as buyers and sellers trade. A nominal dollar value may look healthy while one side of the pool becomes thin enough to make selling painful.
Next, examine recent volume. Volume is useful only in context. If trading activity is large compared with available reserves, the pool may be processing aggressive flow that leaves execution fragile. If volume is tiny, a high liquidity figure may not have been tested by meaningful orders.
The Solana meme-coin liquidity guide is useful for framing the difference between a visible pool balance and the depth needed for practical trading. Don't treat any threshold as a guarantee. Use it as a prompt to inspect the token's actual execution conditions.
Measure price impact directly
Market-microstructure research uses Kyle's price-impact coefficient, λ, to describe how order flow moves price. The Amihud illiquidity ratio approaches the same problem by comparing absolute returns with dollar trading volume. In plain English, a high value means relatively little capital can move the market substantially. The academic overview of Amihud and Kyle's frameworks connects illiquidity with larger required returns and price pressure.
For an automated market maker using a constant-product design, (xy=k), every trade changes the reserve relationship and moves the marginal price. Shallow reserves create nonlinear impact, so a position that looks small at the quoted price may become expensive to unwind.
Run a simple simulation before entering:
- Test a small entry and exit.
- Repeat at your intended position size.
- Test a larger exit that represents a stressed market.
- Record effective slippage, price impact, and the reserve imbalance after each trade.
The best metric is the one tied to your actual behavior. Liquidity isn't adequate because a dashboard says so. It's adequate when your expected exit remains executable under plausible stress.
How Illiquid Markets Enable Rug Pulls
Liquidity is also a failure-containment variable. When depth disappears, ordinary selling can turn into a cascade. A holder doesn't need to steal funds directly to create an exit trap. A sudden withdrawal, concentrated provider position, or coordinated sale can leave remaining traders with a market that technically exists but no longer offers a fair path out.
The BIS analysis of fragile liquidity across asset classes found that average bid-ask spreads fell across major stock, foreign-exchange, and government-bond markets over recent decades, while the skewness and kurtosis of spread distributions increased. That means extreme illiquidity episodes can occur more often than average spreads suggest. The same work warns that algorithmic trading and fragmentation can improve ordinary conditions while making liquidity more fragile during stress.
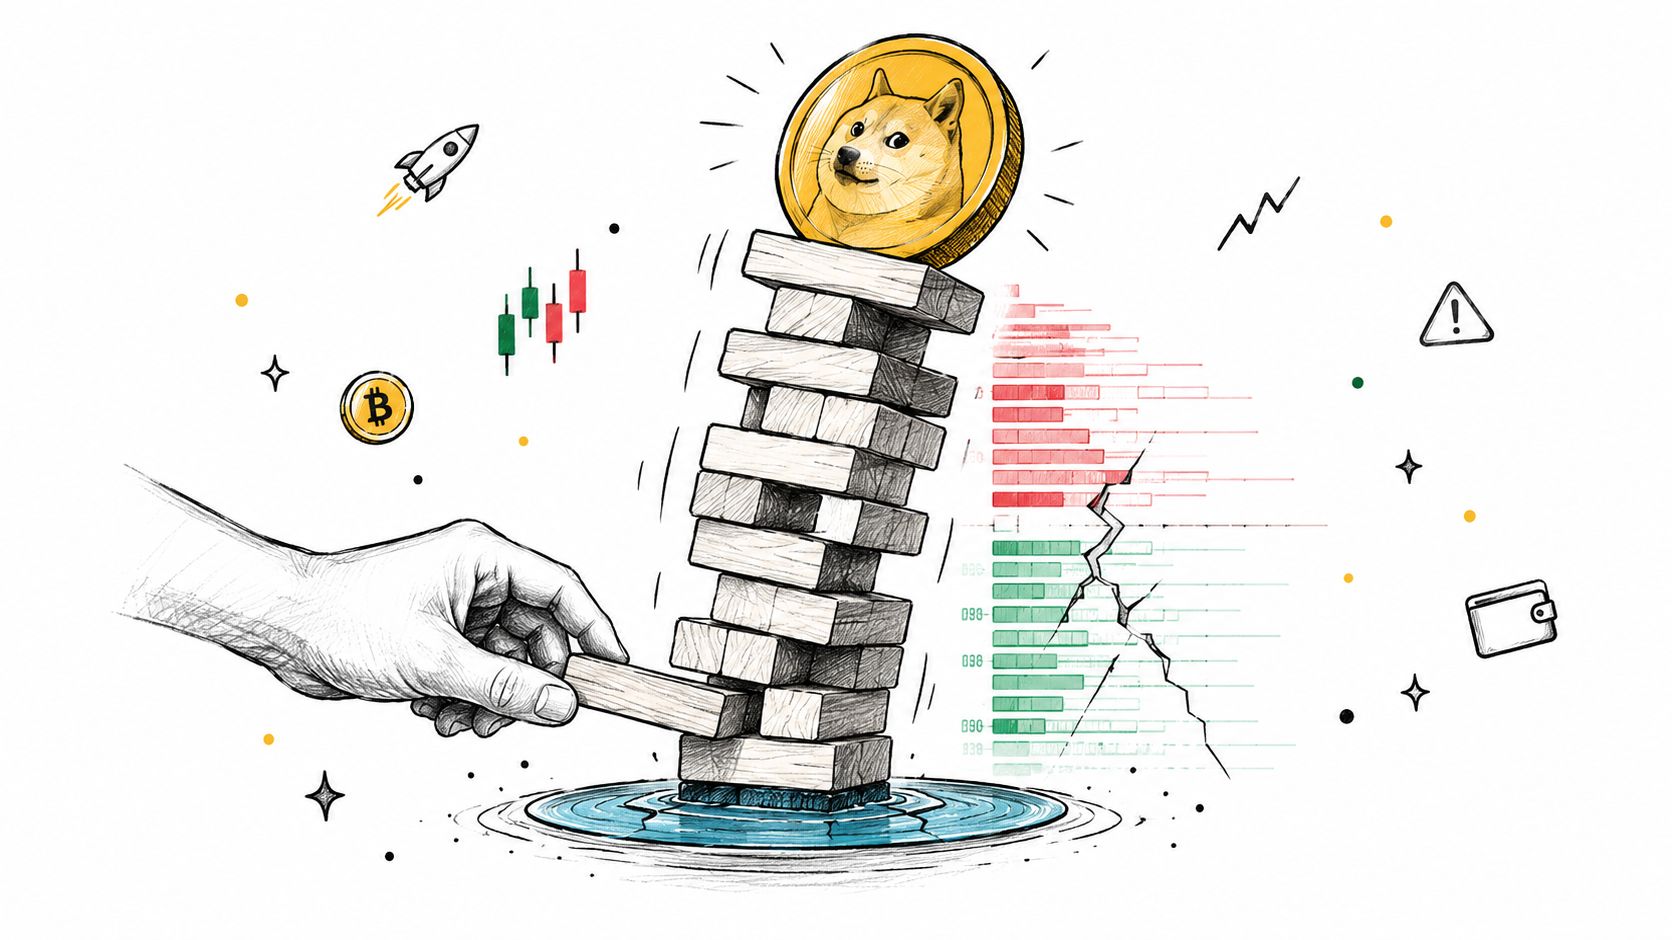
Why the pool can look safe until it isn't
On Solana, displayed liquidity may be:
- Withdrawable: Providers can remove it when incentives or confidence change.
- Inactive: Concentrated liquidity may sit outside the current trading range.
- Fragile: A coordinated sale can consume available reserves faster than buyers replace them.
- Misleading: A total pool value may not reflect the depth available around your execution price.
Liquidity-provider incentives add another layer. Uniswap's documentation on impermanent loss explains that providers can lose relative value when token prices change, with concentrated liquidity increasing the likelihood and severity of that exposure. Volatile meme coins can therefore make providers less willing to maintain active depth, especially when price movement pushes positions outside their useful range.
The result is a feedback loop. Price falls, providers face worse economics or withdraw, active depth decreases, and the next seller creates more impact. A token doesn't need a dramatic contract exploit to produce devastating exit conditions.
This is why thin-liquidity death-zone research belongs in a trader's due-diligence process. Track reserve depth over time, provider behavior, changes in pool composition, and what happens after risk flags. Market cap alone can't show whether the next sale will be orderly.
Practical Liquidity Checks Before You Trade
A repeatable liquidity check should take place before the buy, after the buy, and whenever the token's behavior changes. The goal isn't to predict every move. It's to determine whether the market can support your plan without relying on perfect timing.
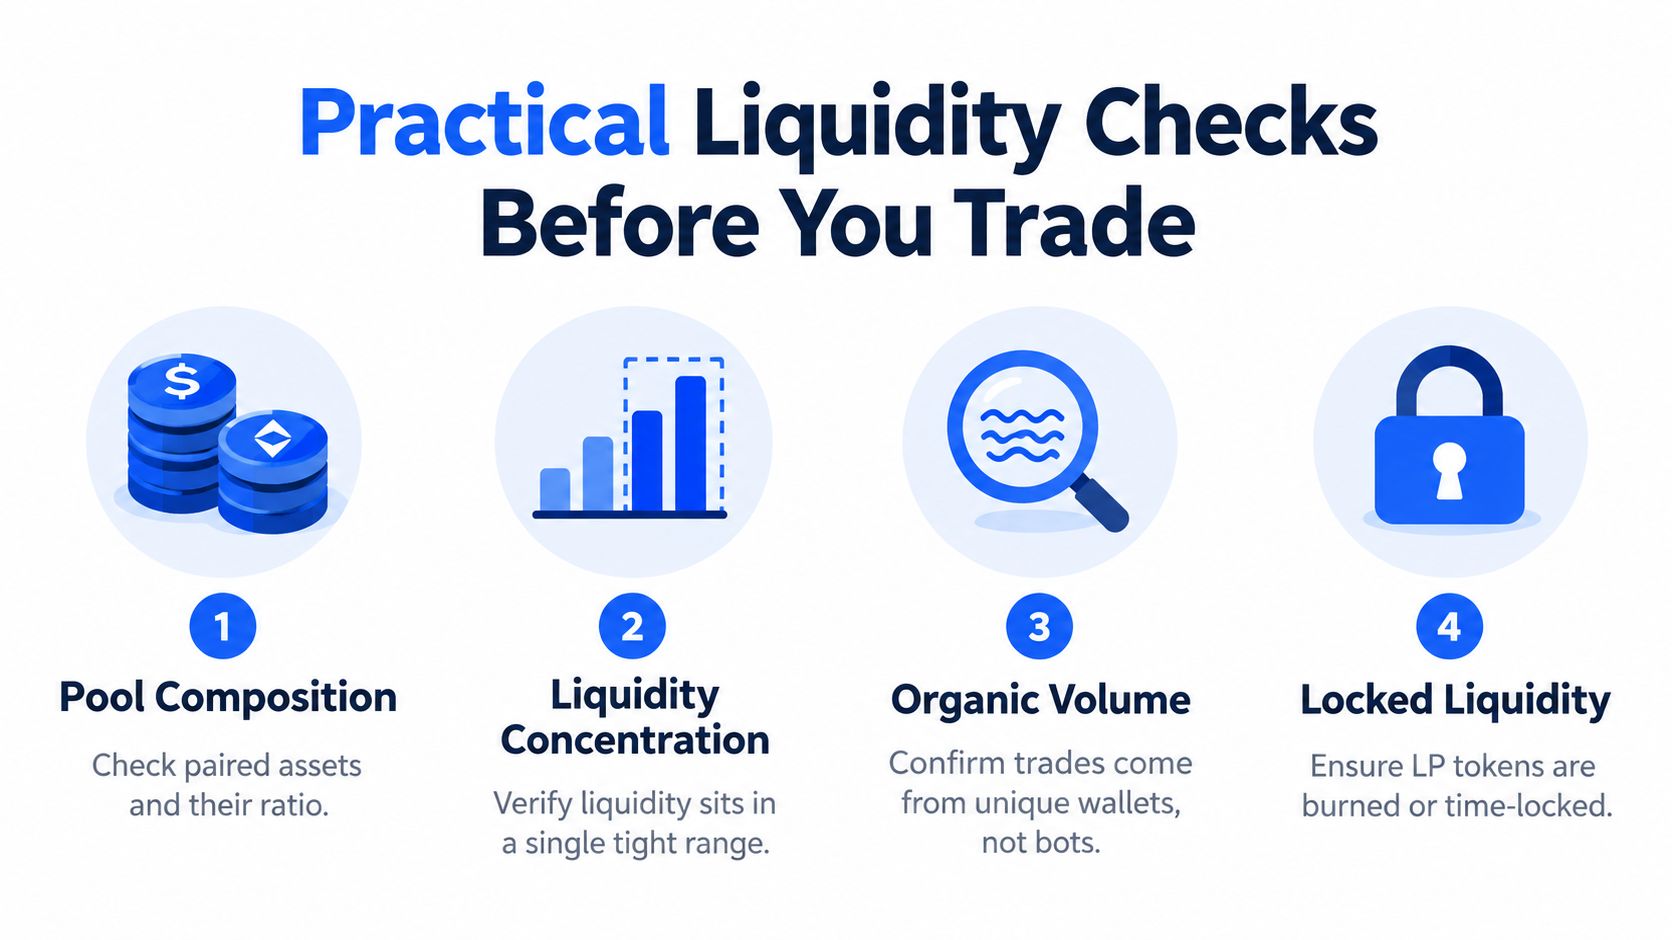
A four-part pre-trade screen
- Pool composition: Identify the paired assets, reserve ratio, and whether the token side is becoming dominant. A pool can show attractive total value while offering poor balance for the exit you expect.
- Liquidity concentration: Check whether usable liquidity sits in one tight range or is distributed across a broader area. Concentration can improve execution in calm conditions, but it can also become inactive when price moves away.
- Organic volume: Look for participation from different wallets and inspect whether activity appears coordinated, repetitive, or bot-driven. Volume without independent demand shouldn't reassure you.
- Provider control: Determine whether liquidity can be withdrawn or shifted, and monitor provider behavior instead of treating a lock indicator as a complete safety verdict.
Stress-test the position
Simulate your intended entry and exit at more than one size. Record the expected slippage, then subtract that cost from the return you think the trade offers. Run the same exercise for a larger sale. If a plausible exit creates a major reserve imbalance, reduce the position or skip the trade.
After entry, monitor changes rather than relying on the original snapshot. Falling depth, unusual volume, concentrated selling, or provider withdrawals should change your risk assessment. A good entry doesn't make an unsafe exit safe.
MemeAssist is one practical option for this workflow. Its Solana token analyzer uses live on-chain and market data to assess liquidity, holder concentration, creator behavior, wallet activity, trading patterns, and historical risk indicators, then presents quantitative outputs with an AI-written explanation. Its Solana liquidity checker can help consolidate the checks before you decide whether the pool supports your position.
Liquidity as Risk Management
Liquidity is a survival skill, not a technical footnote. It can reduce spreads and execution friction for traders, but it can also transmit shocks efficiently and create losses for liquidity providers or users holding margin positions. More depth improves ordinary execution without guaranteeing that the market will remain stable when everyone wants the same exit.
Liquidations show why mechanism design matters. A 2025 Bank of Canada study found that auction-based liquidations reduced price drops on Ethereum when liquidator participation costs were low, but could amplify impact when those costs were high, as described in the Bank of Canada study on liquidation design. The same source discusses impermanent-loss exposure of roughly 3–8% during significant price movements for volatile pairs. Those findings separate trader liquidity from provider returns. A market can offer smoother execution for one participant while shifting risk onto another.
That distinction should shape every Solana trade. Check liquidity alongside holder concentration, creator behavior, wallet activity, and trading patterns. Then ask whether the available depth is controlled by participants who have a reason to stay, or by capital that can disappear as soon as the chart turns red.
The safest liquidity analysis doesn't ask whether a token is liquid. It asks who supplies the liquidity, how stable it is, and what happens when sellers arrive together.
Use position sizing to respect the answer. Simulate the exit before you enter, watch the pool after you enter, and treat sudden liquidity changes as a reason to reassess rather than a footnote in a dashboard. If you can't explain how you would exit under stress, you haven't finished your due diligence.
MemeAssist offers live Solana token risk reports covering liquidity, holder concentration, creator behavior, wallet activity, trading patterns, and historical indicators, with plain-English explanations of the evidence. Run a report before your next trade through MemeAssist and use the liquidity findings to test whether your planned exit is realistic.