Altcoin Season Index: How to Read, Use, and Avoid It
Learn how the altcoin season index works, what its thresholds really signal, and how to pair it with token-level risk checks for smarter crypto trades.
Published
Updated
A market can meet the Altcoin Season Index's definition of broad altcoin outperformance while major altcoins are falling sharply in absolute terms. That tension is the point: the index describes how a selected group of coins performed relative to Bitcoin over a trailing period. It doesn't tell you whether buying now is safe, whether a particular token is sound, or whether the market's gains are durable.
The familiar 75 threshold can look like a clean trading rule, but its meaning depends on which assets a provider includes and how the trailing window shapes the comparison. Read the index as a composition-dependent regime descriptor, not a buy signal. For anyone considering a small or newly launched token, broad market context is only the start of the analysis.
Table of Contents
- Why the Altcoin Season Index Misleads Most Traders
- How the Altcoin Season Index Is Calculated
- Historical Readings and What They Show
- Where the Index Breaks Down and Why That Matters
- How the Altcoin Season Index Compares to Other Breadth Indicators
- Pairing the Index with On-Chain Token Risk Checks
- Using the Index for Timing, Allocation and Risk Management
- Putting It All Together on Your Next Trade
Why the Altcoin Season Index Misleads Most Traders
The 75 threshold isn't a universal buy signal. It certifies a breadth condition under one specific methodology, nothing more. Blockchain Center's widely cited version measures a top-50 universe, while CoinMarketCap's variant uses a top-100 eligible-coin set, so two legitimate readings can disagree on the same day (Blockchain Center's methodology).
That gap matters because neither basket is a fixed portfolio. As market-cap rankings rotate, coins enter and leave the eligible group, and a rising score can partly reflect basket turnover rather than broadening strength. Traders who treat every provider's print as interchangeable are comparing different instruments.
A broad signal can conceal individual losses
The index only asks whether each coin beat Bitcoin over the window. It doesn't grade liquidity, holder concentration, or drawdown severity. A coin can outperform Bitcoin while falling in dollar terms. And a top-50 or top-100 reading says almost nothing about the risk profile of a small, newly launched token that was never in the basket to begin with.
Historical data, covered in detail below, shows the threshold was met in only a small minority of recorded months. Broad outperformance is the exception. Even when it arrives, the regime reading reveals nothing about which individual tokens are safe to hold.
Use the reading to describe the regime, not to approve a trade. Before buying any token, run token-level checks: liquidity depth, holder concentration, creator activity, and trading patterns.
For Solana meme coins, that gap between regime and asset is widest. A large-cap index can flash broad strength while long-tail launches stay illiquid, concentrated, or abandoned within weeks. Tools like MemeAssist address exactly this blind spot, screening the token itself so a market-level reading becomes an asset-level decision.
How the Altcoin Season Index Is Calculated
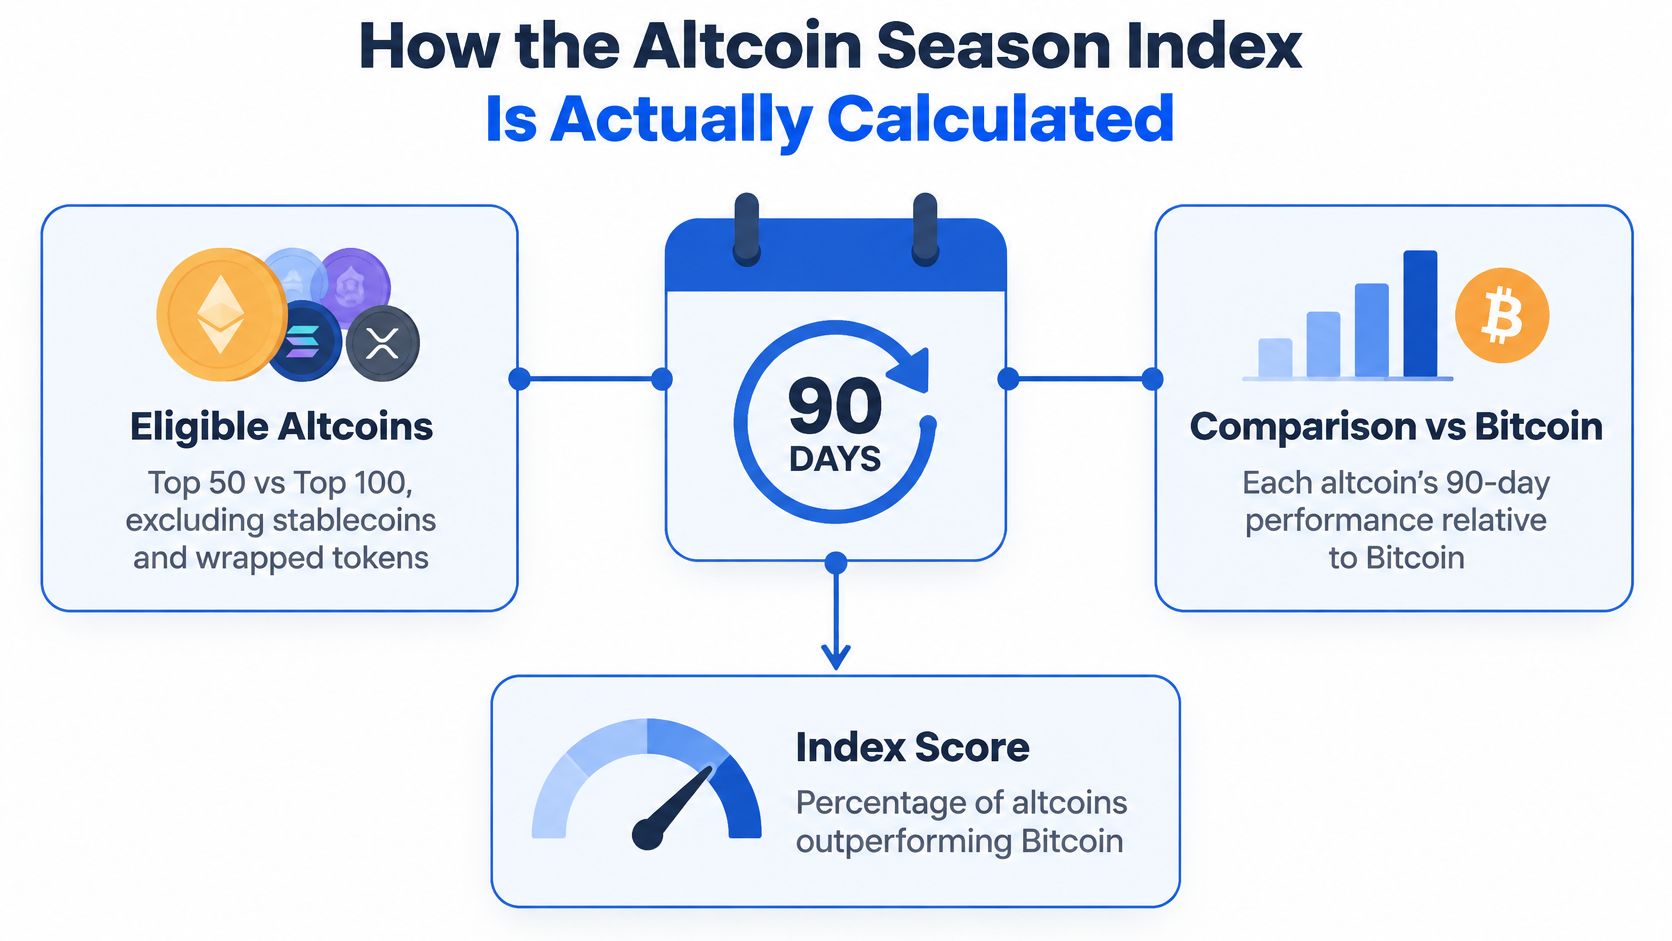
The score is a breadth count: how many eligible coins beat Bitcoin over a rolling lookback period. In the widely used top-50 methodology, the provider compares each eligible altcoin's 90-day return with Bitcoin's return over the same period. Each coin either outperforms Bitcoin or it doesn't, and the score represents the percentage of evaluated coins that did.
The calculation begins with the basket. The top-50 approach excludes Bitcoin, stablecoins, wrapped tokens, and other asset-backed instruments. The selected coins' performance is then compared with Bitcoin's over the same rolling 90-day window. That window filters out some of the noise from isolated daily moves, and it also means the score can retain earlier gains after market conditions have already changed.
Because the basket is defined by eligibility rules rather than by investor holdings, the index describes the composition of relative strength inside that universe. It does not describe whether a given token in your portfolio was measured, liquid, or worth holding.
From individual returns to a regime label
A reading of 75 means at least 75% of the eligible coins beat Bitcoin over the period. In a top-50 universe, that's approximately 38 of 50 coins. The score doesn't mean those coins gained 75%, or that the average altcoin rose by a particular amount. Breadth answers a narrow question: did enough constituents outperform Bitcoin to classify the regime?
The threshold bands are straightforward. Their labels need context:
| Altcoin Season Index Threshold Bands | Regime Label | Practical Read |
|---|---|---|
| 0–25 | Bitcoin Season | Few eligible altcoins beat Bitcoin over the measurement period. |
| 26–74 | Mixed or transitional | Relative leadership is not broad enough to meet either threshold. |
| 75–100 | Altcoin Season | At least 75% of the eligible basket beat Bitcoin. |
These bands describe classification rather than a prescribed portfolio action. A reading below 25 doesn't prove Bitcoin will keep outperforming, just as a reading at or above 75 doesn't confirm that an altcoin rally will continue.
Why providers can disagree
CoinMarketCap commonly evaluates the top 100 eligible assets rather than the top 50, while retaining the same 90-day comparison and 75% threshold. The constituent set and exclusions can therefore differ. Two services can show different scores without either having made an arithmetic error, as the methodology comparison earlier in this article shows.
To reconstruct a reading, identify the provider's eligible basket, collect each asset's return and Bitcoin's return across the same rolling window, count how many eligible assets beat Bitcoin, and divide that count by the number evaluated. The resulting percentage is the index score. Before interpreting it, check which basket the provider used, then check whether the token you plan to trade was inside that basket at all. For long-tail meme coins, it usually wasn't, which is why a regime reading still needs asset-level screening such as liquidity, holder concentration, and creator-activity checks before capital goes in.
Historical Readings and What They Show
The eight qualifying months were not evenly spread across the sample. They clustered in early 2018, mid-2020, the 2021 rally, and August 2022, separated by long stretches where month-end readings never approached the threshold. Altcoin season, measured this way, has been an occasional regime rather than a recurring market state.
The 2021 cluster is the most informative run in the series. March printed 86, April reached 92, May held at 91, and June met the threshold at exactly 75 before the string ended. Earlier, January 2018 recorded 98, among the highest month-end readings in the compilation, and February 2018 recorded 92. Readings that broad mean nearly every asset in the measured basket outpaced Bitcoin over the window. They say nothing about whether the gains persisted, or whether the tokens a retail trader holds were inside that basket at all.
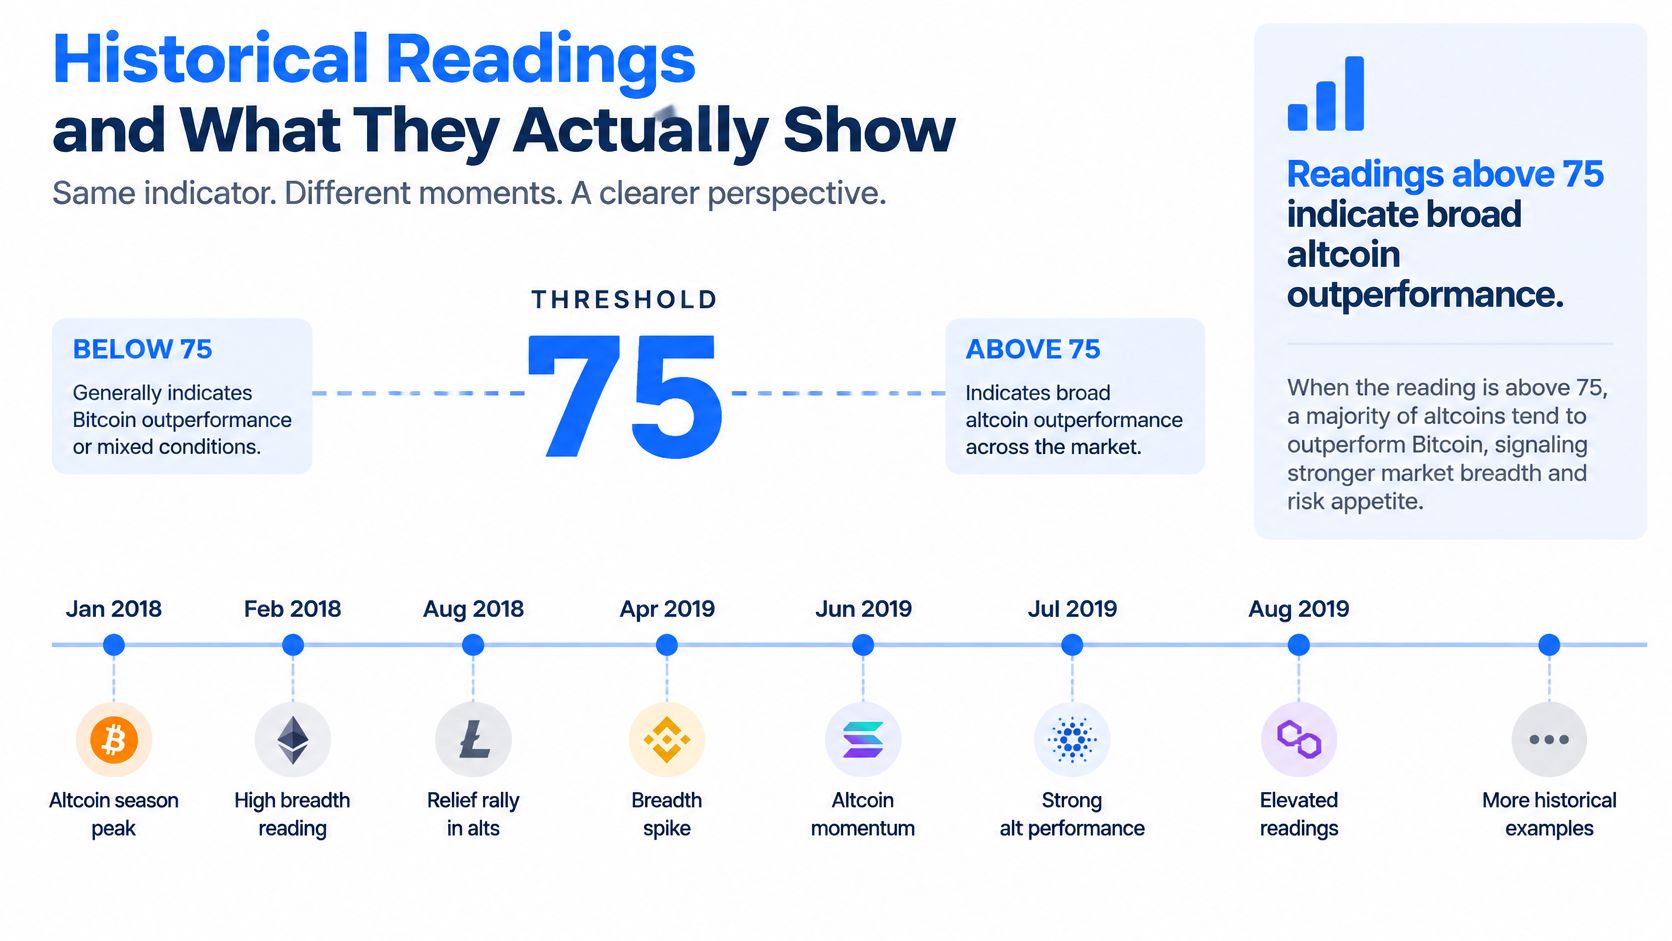
| Months the Index Crossed 75 (Month-End, 2018–2026) | Index Reading | Context |
|---|---|---|
| January 2018 | 98 | One of the highest recorded readings in the compilation. |
| February 2018 | 92 | Broad relative outperformance remained above the threshold. |
| August 2020 | At least 75 | Crossed the Altcoin Season threshold. |
| March 2021 | 86 | Strong breadth during the 2021 cluster. |
| April 2021 | 92 | One of the highest readings in that cluster. |
| May 2021 | 91 | Broad outperformance remained pronounced. |
| June 2021 | 75 | Met the threshold exactly. |
| August 2022 | At least 75 | Crossed the threshold. |
The compilation reports threshold-crossing status for August 2020 and August 2022 without exact scores, so the table marks both as crossing rather than assigning a precise figure. That gap carries a lesson of its own: a historical series can confirm that a regime occurred while leaving the granularity a trader would want unverifiable.
The pattern also undercuts the most common misuse of the index. Each cluster formed with a different roster of eligible assets, so a crossing describes the composition of the market at that moment, not a durable property that carries forward. A 2021-style run tells you breadth was extreme for four consecutive months. It cannot tell you whether a specific meme coin's liquidity, holder concentration, or creator activity justifies exposure today. The regime call belongs to the index. The asset decision still belongs to token-level checks.
The following video offers another visual explanation of the indicator:
Where the Index Breaks Down and Why That Matters
Read the index as a description of a regime, not a signal to buy. Its first weakness is basket composition. Eligible assets change as market-cap rankings shift: a token that gains prominence enters the basket, while one that slides in the rankings or fails drops out. A score can climb partly because the membership changed, not because a stable group of assets improved together. Today's basket may measure a different set of coins than the basket that existed when the lookback period began.
A sharper test follows: would the market still qualify as altcoin season if the basket were frozen at the start of the 90-day window? Standard readings don't answer that question. Without a fixed-basket comparison, a rising score cannot separate broad improvement from constituent turnover, so the headline number overstates how durable the regime is.
Relative performance isn't absolute safety
The second weakness is the gap between beating Bitcoin and making money. Reported conditions put a CoinMarketCap reading around 45–50 alongside Bitcoin dominance near 58%, and from an October 2025 peak into mid-2026 reported declines ran roughly 43% for Bitcoin, about 60% for Ether and XRP, and about 70% for Solana (analysis of index interpretation and market drawdowns). Breadth can look constructive while portfolios absorb heavy absolute losses.
The lookback window creates a third problem. The same analysis noted that a 30-day gauge briefly rose above 75 before falling to 29, while the 90-day measure stayed higher. Trailing windows retain earlier gains after momentum has already turned, so a single headline score can mask deterioration that a shorter horizon would expose.
The index gives each eligible coin one vote. It doesn't weigh those votes by liquidity, drawdown, holder quality, or fraud risk.
For large caps that omission is tolerable. For meme coins it isn't. A composition-dependent regime descriptor says nothing about a token's contract permissions, holder concentration, or liquidity depth, which is where a token-level risk tool such as MemeAssist becomes the working layer. A regime reading sets the backdrop. Token-level evidence decides whether any single position deserves capital.
How the Altcoin Season Index Compares to Other Breadth Indicators
No single indicator captures every feature of market rotation. The Altcoin Season Index counts eligible assets beating Bitcoin; other tools describe market-cap share, price trends, or token-specific risks. Comparing them helps identify what a reading can support, and where it stops.
| How Common Crypto Breadth Indicators Compare | What It Measures | Horizon | Key Blind Spot |
|---|---|---|---|
| Altcoin Season Index | Share of eligible altcoins outperforming Bitcoin | Rolling 90-day comparison in the common methodology | Basket turnover, liquidity, absolute losses, and token safety |
| Bitcoin dominance | Bitcoin's share of total crypto market capitalization | Changes with market capitalization | Doesn't establish which altcoins are gaining or whether they're safe |
| Bitcoin Season gauge | Breadth favoring Bitcoin rather than altcoins | Depends on the provider's methodology | Doesn't assess drawdown, liquidity, or an individual token |
| Percentage above moving averages | Share of a chosen asset group trading above a selected trend measure | Depends on the moving average and sampling period | Doesn't measure Bitcoin-relative returns or token safety |
| Market-cap breadth | Distribution of market-cap growth across a chosen group | Depends on the assets and period selected | Can be influenced by the largest assets and doesn't reveal trading depth |
| On-chain token safety checks | Token-specific evidence such as liquidity, holders, creator activity, and trading patterns | Snapshot or live-data analysis, depending on the tool | Doesn't establish the market-wide regime |
Bitcoin dominance and the Altcoin Season Index can complement each other, but neither proves a simple capital-flow story on its own. Dominance describes Bitcoin's portion of total market capitalization, while the index measures how many selected altcoins beat Bitcoin over a set window. One can change without the other moving in lockstep.
Moving-average breadth adds a different question: how many assets are above a chosen trend level? Market-cap breadth asks how widely market value is distributed. Both can help reveal whether a rally is concentrated or broad, but their readings depend on their chosen asset groups and definitions. A trader should check those choices before comparing signals across providers.
For Solana meme-coin traders, macro breadth remains far removed from token-level safety. A large-cap basket can't identify a concentrated holder base, suspicious creator behavior, thin liquidity, or unusual trading patterns in an individual launch. A separate meme-season index guide can help frame meme-market context, but token-specific checks still matter before taking risk.
Pairing the Index with On-Chain Token Risk Checks
A market regime reading can tell you whether relative strength is broad among a selected group of established assets. It can't tell you whether a specific Solana token has sound liquidity, a concentrated holder base, suspicious creator activity, or trading behavior that warrants caution. Those questions belong to a separate layer of analysis.
Start by separating market context from token evidence. The index may shape how aggressively you search for opportunities, but it doesn't certify any candidate. A token-level review should examine the available evidence around liquidity, ownership concentration, creator behavior, wallet activity, trading patterns, and historical risk indicators. Those categories help turn a vague impression of momentum into questions you can test.
A practical screening sequence
- Read the market regime. Note the provider, its eligible basket, the current reading, and whether shorter-term conditions appear to support the broader picture.
- Build a candidate list. Treat narratives and price moves as ways to find tokens to investigate, not as evidence of safety.
- Review each token's on-chain and market signals. Look for thin liquidity, concentrated holdings, suspicious wallet behavior, creator-related concerns, or trading patterns that don't fit the apparent demand.
- Match position risk to the evidence. If the token's safety profile is unclear or deteriorating, a favorable market regime doesn't remove that uncertainty.
- Set an exit condition before entry. Decide what change in market conditions or token-specific evidence would make you close or reduce the position.
This sequence prevents a common analytical shortcut: seeing a high-level breadth signal and treating it as proof that a speculative token is investable. A broad regime can support a larger research pipeline. It can't replace the work of checking the contract, liquidity, holders, and trading activity for each candidate.
For a deeper checklist, use this guide to Solana token safety checks. The goal isn't to eliminate uncertainty. It's to make the risks visible before a trade, so the index informs the decision without making it for you.
Using the Index for Timing, Allocation and Risk Management
The index can help organize a trading plan if each regime changes your questions rather than dictating a buy or sell. A low reading suggests asking why eligible altcoins have lagged Bitcoin. A middle reading calls for attention to mixed leadership. A reading at or above 75 indicates unusually broad relative outperformance, but it still doesn't tell you whether the market's gains are durable or whether any particular asset is safe.
Let the regime inform, not replace, your rules
During Bitcoin Season, consider narrowing the candidate list and avoiding the assumption that a weak altcoin will catch up. In a mixed regime, distinguish isolated winners from broader participation and avoid treating one sector's strength as a market-wide rotation. During Altcoin Season, wider participation may justify researching more candidates, but it doesn't justify skipping token checks or ignoring downside.
Before entering, define what would make the trade valid and what would invalidate it. That can include a market condition, a token-specific safety concern, or a maximum loss you're willing to accept. The exact rule should fit your own strategy; the index's classification alone can't supply it.
Make the exit rule independent of the index. If a token's liquidity, holder behavior, or other safety evidence deteriorates, reassess the position even if the broader reading remains elevated.
Watch for disagreement between short- and longer-horizon breadth as a reason to investigate, not as an automatic exit command. The reported example of a 30-day reading dropping while the 90-day measure stayed higher illustrates how older returns can keep a longer window high. Before acting, ask whether the divergence reflects fading participation, a still-strong trailing period, or a change in the measured basket.
Position sizing should follow the risk of the asset and your predefined loss limits, not the confidence implied by a headline score. Avoid chasing a high reading after a sharp move; by definition, the index confirms relative performance over a period that has already passed. For practical planning around exits, see this guide to when to sell Solana memecoins.
Putting It All Together on Your Next Trade
The Altcoin Season Index is most useful when you treat it as a description of market breadth, not a forecast or approval stamp. Its readings are episodic, providers use different baskets, and the score says little about the safety of a long-tail token. Those limitations don't make the index useless. They define what else you need to check.
Before your next trade, confirm the provider and its basket, interpret the reading as regime context, shortlist candidates, review each token's liquidity and on-chain risk evidence, size the position to a predefined loss limit, and decide in advance what would trigger an exit.
The index describes the regime. It doesn't make the trade safe.
MemeAssist provides on-demand Solana token risk reports using live on-chain and market data, with an Overall Health Score, Rug Risk Rating, AI Verdict, Detailed Risk Breakdown, and Trade Setup summary. Use it to examine token-level evidence alongside the market context, then visit MemeAssist to assess your next candidate before you trade.