10 Best Trading Patterns: Rules, Timeframes and Examples

You've spotted a textbook bull flag on a Solana token that launched four hours ago. The pole is clean, the flag drifts down in a tight channel, volume fades the way it's supposed to. You buy the first green candle off the flag low. For ninety seconds it works. Then the pool thins out in a single block, price slides through the flag low, and the whole setup becomes a screenshot in someone's warning thread.
The chart was real. The intent behind it wasn't what you assumed. A pattern describes the shape price made, not who made it, not why, and not what they plan to do next. On a liquid market, thousands of independent participants produce that shape by accident. On a Solana pair with a small pool and a handful of concentrated holders, two wallets can produce the same shape on purpose.
This roundup gives ten of the best trading patterns a full rule set each: the structure, the confirmation that has to happen before the pattern counts, the failure mode that catches most traders, and the extra verification a meme coin demands before you risk anything. The failure modes below are the ones I plan around before every entry, not theoretical risks. Treat the rules as an analysis filter, not a set of instructions. No pattern on this list guarantees an outcome, and any guide that tells you otherwise is selling something.
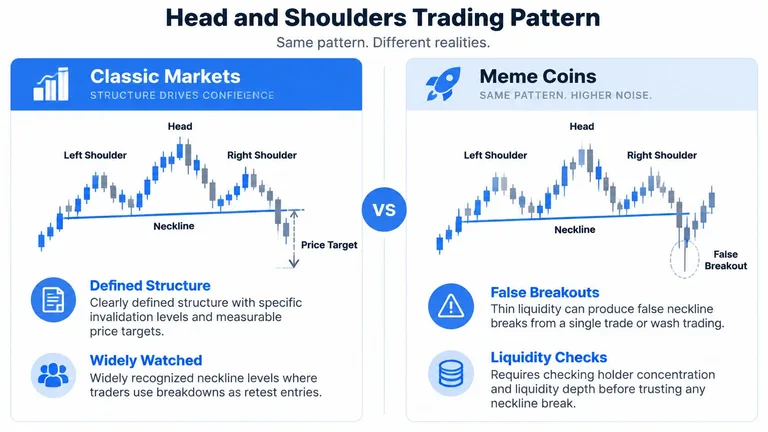
Table of Contents
- 1. Head and Shoulders
- 2. Inverse Head and Shoulders
- 3. Double Top
- 4. Double Bottom
- 5. Ascending Triangle
- 6. Descending Triangle
- 7. Symmetrical Triangle
- 8. Bull Flag
- 9. Cup and Handle
- 10. Falling Wedge
- Best Trading Patterns at a Glance
- Turn Pattern Spotting Into Verified Decisions
1. Head and Shoulders
Head and shoulders is the first pattern most traders learn and the one they misread most often on Solana. Price prints three peaks: a left shoulder, a higher head, then a right shoulder that stalls near the level of the left. The neckline runs beneath the two troughs. A candle close below it confirms the pattern, and the measured target is the head-to-neckline distance projected down from the break.
The pattern carries genuine historical weight. A review of technical analysis found head and shoulders produced statistically significant annual returns of roughly 13% for the German mark and 19% for the Japanese yen across 1973 to 1994, as reported in the Cogent Economics & Finance study of chart-pattern profitability. Those were deep, continuously traded currency markets. A token with a shallow pool is a different problem entirely.
Reading It on a Thin Pair
- Wait for the close. An intraday wick through the neckline is noise when one wallet can move price. Demand a closed candle on the 1h or 4h.
- Check who is selling. A real break shows sell volume spread across many wallets. Three addresses dumping into a shallow pool produces the same chart with none of the meaning.
- Place the stop above the right shoulder. That level defines your risk. If the distance is too wide for your position size, skip the trade.
Practical rule: No close below the neckline, no trade. The shape on its own is not a signal.
Before you trust any neckline break here, check holder concentration and the depth of the pool. A break that only moves price because the book is empty isn't a reversal.
2. Inverse Head and Shoulders
Bottoms take longer to build than tops, and the inverse head and shoulders is the shape that shows the work. Three troughs with the deepest in the middle, a neckline connecting the two rally highs between them, and a close above that line as confirmation. The target is the head-to-neckline height added to the break point.
The failure mode is subtle. A token that has been losing value for days will often print a higher low because the seller ran out of tokens, not because buyers arrived. That higher low looks identical to the genuine pattern on a chart.
Confirmation Checklist
- Volume on the right side. The right trough and the breakout should carry more volume than the head did. Without that, you're watching a bounce, not a reversal.
- Participation spread. Confirm the breakout buying comes from many wallets, not a launch bundle being dribbled into the market.
- The retest as a second entry. Plenty of clean breaks come back to the neckline. A retest that holds as support is often a better entry than the breakout candle itself.
Put the stop below the right trough. If price closes back under the neckline after the retest, the pattern is dead and you take the small loss without arguing with it.
One Solana-specific check sits on top of all this. Has the creator wallet been selling into the supposed accumulation? A higher low built while the deployer distributes isn't a bottom, it's a handoff.
3. Double Top
A double top is two failed attempts at the same resistance, and on meme coins that resistance is usually a round number every holder is watching. Price hits the level, pulls back to a trough, hits it again, then rolls over. Confirmation is a close below the trough. The measured target is the peak-to-trough height subtracted from the break.
What Separates a Real Top From a Pause
The second peak matters more than the first. If volume on the second push is clearly weaker, buyers are running out of conviction. A second peak that closes above the first isn't a double top at all, it's continuation, and treating it as a short is how accounts get cleaned out.
- Same wallets at both peaks. Pull the transaction list. If the seller at peak one is the seller at peak two, the "distribution" may be a single entity and the pattern may be theater.
- Volume quality over volume size. One large buy can make a histogram look healthy for an hour.
- Plan the exit before the entry. Decide whether you're scaling out into strength or trailing once the break happens. The difference between a fixed take-profit ladder and a trailing stop approach matters more than the pattern does.
Stop just above the second peak. Anything tighter gets tagged by ordinary noise before the thesis has a chance to play out.
4. Double Bottom
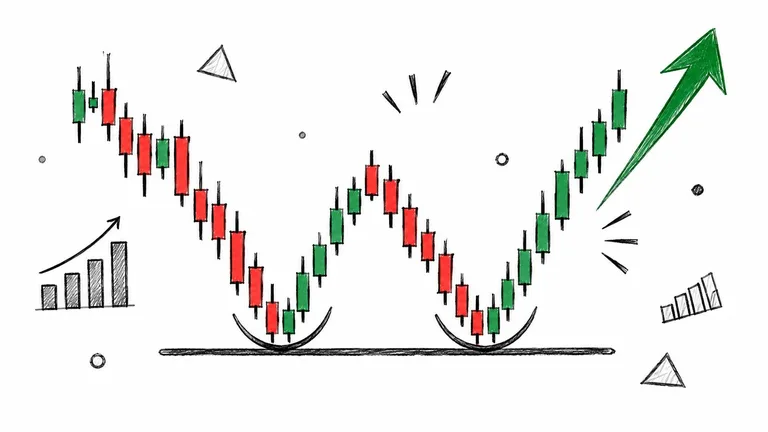
Double bottoms are the most over-called pattern on Solana. Two tests of a support level that hold, a peak between them, then a close above that middle peak. The target is the trough-to-peak height added to the break. Clean in theory, slippery in practice.
The problem is that thin pools print lows that mean nothing. A small pool can wick down sharply on a single sell and snap straight back, handing you a beautiful second trough that was really just someone's exit.
Checks Before You Believe the W
- Lower volume on the second trough. Seller exhaustion is the whole thesis. A second low on heavier volume means buyers aren't defending anything.
- Real liquidity at the support zone. Look at pool depth, not just the price line.
- A close above the middle peak. Not a wick, not a one-minute candle. A close on the timeframe you're trading.
Watch for a higher low paired with a flat or rising holder count. That combination is the closest thing to a genuine accumulation signature a meme coin will give you.
Stop below the lower of the two troughs. If the second low undercuts the first by a wide margin, the setup has failed and the pattern no longer applies.
5. Ascending Triangle
An ascending triangle is compression. Flat resistance on top, higher lows underneath, buyers absorbing every dip into the same ceiling. The signal is a close above resistance, ideally with expanding volume, and the target is the height of the triangle's widest point added to the breakout level.
The Volume Trap
On liquid markets this is a reasonable continuation signal. On Solana, volume misleads more often than it confirms.
Bitcoin on-chain research found that fewer than 1% of users accounted for more than 95% of market volume, per the European Journal of Finance study of Bitcoin transaction records. If that concentration can exist on the deepest crypto network in the market, assume it exists on a week-old meme coin with a hundred holders.
Before you buy the breakout:
- Count wallets, not trades. Five hundred buys from twelve addresses is one buyer with a script.
- Look for repeat wallet clusters. Bundles that fired together at launch tend to fire together on breakouts.
- Check the spread. A wide spread on the breakout candle means you're paying for the privilege of being early.
Stop below the rising trendline. If the break comes on thin volume and stalls within a candle or two, exit fast rather than waiting for the pattern to reassert itself.
6. Descending Triangle
Invert the ascending version and you have a descending triangle: flat support, lower highs pressing down on it, sellers reloading every bounce. The break is a close below support, and the target is the triangle's base height subtracted from the break.
This shape is common during the slow bleed after a launch hype cycle. It's also the pattern most easily manufactured, because holding a price just above a support line is cheap when the pool is small and the order book is thin.
Where the Signal Breaks
- Fake support. A creator wallet resting bids at the line makes the triangle look solid right up until those bids are pulled.
- The retest is often the trade. Waiting for broken support to flip into resistance gives you a tighter stop than chasing the first break.
- Confirmation over prediction. Don't short a descending triangle before the break. Plenty of them resolve upward when a single buyer steps in.
A descending triangle in a token with a rising holder count is contradictory evidence. Contradictions are a reason to cut position size, not a reason to pick a side and hope.
Stop above the most recent lower high. On Solana, establish whether the sell pressure is one wallet or many before you assume the floor gives way.
7. Symmetrical Triangle
A symmetrical triangle is a coil. Lower highs and higher lows converge toward an apex, and the pattern has no directional bias until price closes beyond one of the trendlines with volume. Target is the base height projected from the break in whichever direction it resolves.
Confirmation Beats Prediction
A systematic review of cryptocurrency market microstructure reports that variable-length moving-average strategies outperformed fixed-length versions and simple trading-range breakouts in Bitcoin studies, while noting that costs, slippage, and regime changes erode most of the apparent edge, according to the Annals of Operations Research review. That caveat is the whole game.
A coil breakout on Bitcoin with deep books is a different proposition from the same shape on a token where the top wallets hold most of the supply.
- Trade the close outside the trendline, never the touch of it.
- Use the prior trend as context, not as a promise about direction.
- Avoid low-liquidity hours. Breakouts that happen while half the market sleeps get reversed when it wakes.
- Keep stops inside the triangle. If you're stopped out before the apex, the entry was never good.
One more Solana check. Ask whether the coiling period came with steady or falling holder count. Steady is fine. Falling while price holds flat is distribution in slow motion.
8. Bull Flag
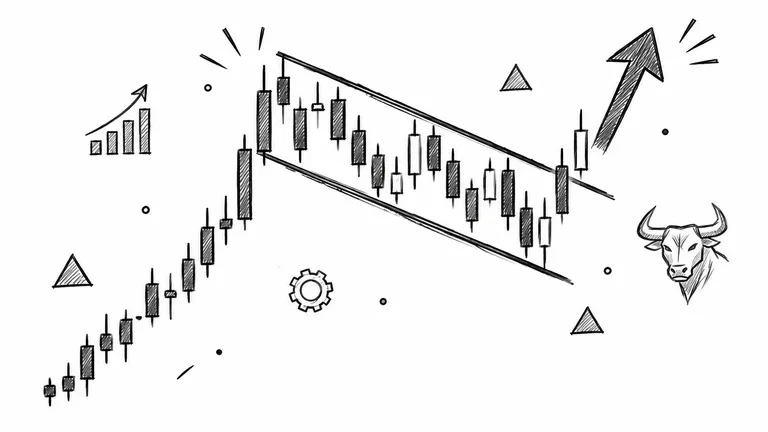
Bull flags cause more bad entries on Solana than any other pattern, and they're also the most useful once you apply a filter. Structure: a sharp rally as the flagpole, then an orderly drift lower in a parallel channel on lighter volume as the flag. The trade is the close above the flag's upper boundary, with a target equal to the flagpole height added to the break.
Momentum Is a Tendency, Not a Promise
The academic case for momentum is real. Jegadeesh and Titman ranked U.S. stocks on cumulative returns over prior periods of 3 to 12 months across 1965 to 1989, and found winner portfolios outperformed loser portfolios by as much as 1.49% per month, per their 1993 Journal of Finance study of momentum.
Read the rest of that finding. The authors noted the abnormal performance weakened over the two years after formation and depended heavily on measurement period, holding period, and portfolio construction before costs. Directional persistence exists. It isn't a guarantee, and it definitely isn't a guarantee on a token with a four-hour history.
The Solana Filter
- Was the flagpole one candle? A vertical single-candle pump is usually a bundle, not demand.
- Is the flag drifting on lower volume? Healthy. A flag on rising volume is often an exit in progress.
- Who bought the pole? If the top wallets bought in the first minute, you're the exit liquidity.
Work out your entry and exit timing before you size the trade. Stop at the flag low.
9. Cup and Handle
The cup and handle is a slower structure, which is exactly why it's rare on meme coins. A rounded U-shaped cup after an uptrend, then a shallow drift lower that forms the handle. The handle should be smaller than the cup's depth and should drift on declining volume. The break is a close above the handle high, with the cup depth added to the break as a target.
William O'Neil popularized the setup as a core part of his growth-stock methodology, and the discipline it enforces is the valuable part. A proper cup takes time. Most launch-phase tokens don't have time to give.
When the Cup Is a Stage Set
The pattern turns dangerous here. On-chain research covering 34,988 tokens found that 82.8% of tokens reaching returns above 100% showed evidence of artificial growth tactics, including wash trading and liquidity-pool-based price inflation, per the arXiv study of meme-token growth.
A rounded base with steady volume can be genuine accumulation. It can also be the same handful of wallets trading in circles to paint a floor while the creator sells into it.
- Confirm the handle is shallower than the cup.
- Check that liquidity grew across the base, not just price.
- Verify holder count expanded, which is the one thing wash trading can't fake cheaply.
If the base looks perfect and the holder count hasn't moved, you're looking at a stage set.
Stop at the handle low. Treat any cup that formed inside a single session as a flag instead, because that's what it is. Test the shape against your own backtesting of Solana trade setups before you give it real size.
10. Falling Wedge
A falling wedge narrows as price drops, with the lower trendline steeper than the upper. Selling pressure fades even though price keeps printing lower. The break is a close above the upper trendline, and the target is the widest part of the wedge added to the break.
Wedges are where market regime matters more than geometry. A wedge resolving upward in a healthy tape is a normal reversal. The same wedge in a market that's bleeding out often fails and becomes a pause before the next leg down.
The Regime Check
The memecoin cycle itself makes the point. CoinGecko recorded memecoin volumes rising from a daily average of $1.1 billion in 2023 to $9.7 billion in 2024, before the sector's market capitalization fell to $47.2 billion by November 2025 following the TRUMP and LIBRA launches and the decline that followed, as reported in UCL research on Pump.fun meme coin trading.
That's the environment your wedge is resolving into. Pattern quality didn't change between those two periods. The flow did.
- Require a close above the upper trendline with rising volume.
- Look for new buyers, not just a pause in selling.
- Treat a failed break as information. If price closes back inside the wedge, the bullish case is gone.
Stop below the wedge low. Confirm liquidity held steady for the whole formation before you act on the break.
Best Trading Patterns at a Glance
| Item | Bias | Confirmation | Target Rule | Stop Placement |
|---|---|---|---|---|
| Head and Shoulders | Bearish reversal | Close below the neckline | Head-to-neckline distance projected down from breakout | Above the right shoulder |
| Inverse Head and Shoulders | Bullish reversal | Close above the neckline, ideally with strong volume | Head-to-neckline distance projected up from breakout | Below the right shoulder trough |
| Double Top | Bearish reversal | Close below the trough support | Peak-to-trough height projected down from breakdown | Above the second peak |
| Double Bottom | Bullish reversal | Close above the middle peak | Trough-to-peak height projected up from breakout | Below the lower trough |
| Ascending Triangle | Typically bullish continuation | Close above resistance, ideally with rising volume | Triangle base height projected up from breakout | Below the rising trendline |
| Descending Triangle | Typically bearish continuation | Close below support with expanding volume | Triangle base height projected down from breakdown | Near broken support or above a retest |
| Symmetrical Triangle | Neutral; breakout can go either way | Close beyond a trendline with volume | Triangle base height projected in the breakout direction | Inside the triangle after confirmation |
| Bull Flag | Bullish continuation | Close above the upper flag boundary | Flagpole height projected up from breakout | Below the flag low |
| Cup and Handle | Bullish continuation | Breakout above handle resistance, ideally with expanding volume | Cup depth projected up from breakout | Below the handle low |
| Falling Wedge | Typically bullish reversal or continuation | Breakout above the upper trendline with rising volume | Wedge's widest height projected up from breakout | Below the wedge low |
Turn Pattern Spotting Into Verified Decisions
A clean-looking bull flag can still fail if launch buys were bundled, liquidity is thin, or the creator is selling. Treat each chart pattern as a hypothesis: wait for its confirmation rule, usually a candle close rather than a wick, then check the on-chain evidence before considering a trade.
Keep a record of the pattern, confirmation, market conditions, and outcome for each setup. Reviewing those records can show which patterns fit the conditions you trade and which deserve less weight. A chart alone cannot show liquidity depth, holder concentration, bundle activity, or creator-wallet behaviour.
MemeAssist checks those factors across six signal categories: liquidity, holder distribution, creator behaviour, wallet activity, trading patterns, and historical risk indicators. A full analysis checks for a conditional Trade Setup. Entry, stop, and target levels appear only when the token's current price structure supports them. These are analysis scenarios, not trading instructions, and they do not predict an outcome or guarantee execution at the displayed price.
MemeAssist also tracks flagged tokens' outcomes over 24 hours and uses those observations to evaluate signal reliability. A full token analysis costs $0.20, and new users get one free full analysis.
A pattern is a question, not a decision. Verify it against the available evidence, then size the position for the possibility that the setup fails.
The next time a flag, triangle, or wedge looks convincing, run the token through MemeAssist before considering a trade. Its report combines the evidence behind the token's risk assessment with a conditional trade scenario when price structure allows one. No wallet connection is required.
Topics: best trading patterns, trading patterns, chart patterns, Solana meme coins, technical analysis
Informational only, not financial advice. Meme coins are extremely high-risk.
All articles