The Best Risk Assessment Methodology: 7 That Actually Work
Search for the best risk assessment methodology and you'll find ranked lists that treat frameworks like football teams. That framing fails the moment you use it. FMEA exists because engineers needed to find every way hardware could fail. Fault tree analysis exists because the Minuteman program needed to prove a launch control system wouldn't fire by accident. FAIR and VaR exist because boards and regulators wanted losses expressed in money and probabilities. Each solved a different problem, and each breaks in a specific place when you point it at a Solana meme coin with four hours of trading history.
What follows is a practitioner's tour of seven methods that hold up under real use. For each one, you get what it does well, where it fails, the trade-off you accept by adopting it, and a concrete translation into token-risk work. FMEA's severity and occurrence scoring maps onto mint and freeze authority. Fault trees isolate the smallest combination of conditions behind a rug. A bow-tie keeps prevention and exit planning in one picture. MemeAssist's structured scoring draws on the same logic, which makes the comparisons below practical rather than academic.
Table of Contents
- 1. Failure Mode and Effects Analysis (FMEA)
- 2. Fault Tree Analysis (FTA)
- 3. Hazard and Operability Study (HAZOP)
- 4. Bow-Tie Analysis
- 5. ISO 31000 Risk Management Framework
- 6. Factor Analysis of Information Risk (FAIR)
- 7. Value at Risk (VaR)
- 7 Risk Assessment Methodologies Compared
- Choosing and Combining Your Risk Assessment Stack
1. Failure Mode and Effects Analysis (FMEA)
FMEA is bookkeeping for failures that have not happened yet. You enumerate every failure mode a component or process can produce, score each on severity, occurrence, and detectability, multiply the three into a Risk Priority Number, and fix the highest totals first.
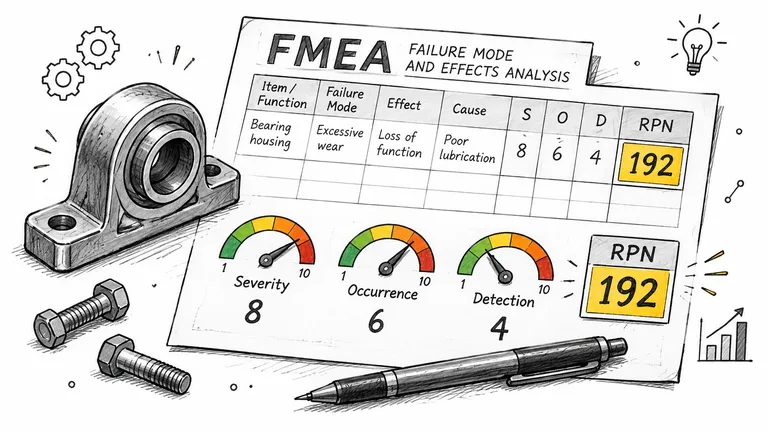
The scoring is almost beside the point. The habit it builds is the valuable part: you think about how things break before they break. NASA engineers used it on Apollo spacecraft hardware reliability, and it remains standard in automotive work under the AIAG and VDA handbooks (now harmonized into a single document), in aerospace, and in medical device design controls built around ISO 14971 principles.
Translating FMEA to a token
For a Solana token, the components are authorities, liquidity, and holders. The failure mode list writes itself once you look: mint authority still live, freeze authority still live, LP tokens accessible or concentrated in one wallet, top holders able to dump, creator wallet sitting on supply, bundled buys at launch.
Score each mode against written criteria. Define what a 9 in severity means versus a 5, or scores drift between analysts and stop being comparable across tokens. A live mint authority is a clean test case: severity is high because supply can be inflated, occurrence is unknown because it hinges on creator behaviour, and detection is strong because authority status is readable on-chain. MemeAssist's reports run the same enumeration, checking mint and freeze authority alongside liquidity, holder distribution, creator behaviour, wallet activity, trading patterns, and historical risk indicators.
Add a critical override. Any severe, easily triggered mode gets flagged regardless of its RPN, which keeps a rare catastrophic mode from being buried by the arithmetic.
The override matters because multiplication hides things. A severe, frequent, easily detected failure mode can produce the same RPN as a minor, rare, nearly invisible one. The arithmetic cannot tell them apart. NIST Special Publication 800-30 keeps likelihood and impact as separate factors for exactly this reason, so a high-impact, unlikely event is never scored like a frequent, low-impact one (NIST SP 800-30 risk assessment guide).
The trade-off. Detection is the weak link. Authority status is directly checkable on-chain, so that detection score is earned. Insider cost basis cannot be observed, so its score is a guess dressed as a number, and the guess drags the RPN down even when the mode deserves attention. Before trusting your weights, test which Solana rug risk signals preceded failures in tokens whose outcomes you can check after the fact.
2. Fault Tree Analysis (FTA)
Fault tree analysis runs the other direction. You name one undesired top event, then work backward through AND and OR gates until you reach basic events you can observe. Bell Labs built the technique for the Minuteman missile program's launch control system, and the Rasmussen reactor safety study used fault trees to estimate nuclear accident probabilities, which is why aerospace and nuclear safety cases still lean on them.
Start from the exit, not the entry
Set the top event as something you can define and measure, such as a holder being unable to exit at the quoted price within 24 hours. Then build down. Liquidity pulled OR (top-holder concentration high AND LP depth thin) OR freeze authority exercised. The minimal cut sets fall out of that structure: the smallest combinations of basic events that lead to the top event are what you monitor.
Use observable on-chain signals as basic events, or the tree becomes fiction. LP lock status, holder concentration windows, creator wallet movements, and bundle-buy clusters all qualify. Validate thresholds against outcomes. A cut set built from "top holders above a threshold AND LP depth below a multiple of hourly volume" is a hypothesis, and it should be checked against tokens that later lost liquidity.
A fault tree is a hypothesis about causation drawn as a picture. It's only worth the effort if you eventually test the picture against what happened.
Where it breaks. Probabilities need reliable base rates, and a token with two weeks of history has none. Use FTA for structure and cut sets, not for the final probability number. The moment you present a calculated top-event probability without a base rate behind it, you've replaced a guess with a decimal point.
3. Hazard and Operability Study (HAZOP)
HAZOP is a meeting with rules. A team takes a system, applies guide words to each parameter, and asks what happens if that parameter goes missing, higher, lower, reversed, or becomes something else entirely. Imperial Chemical Industries developed it, the Flixborough disaster pushed process operators to formalize it, and oil, gas, chemical, and pharmaceutical design reviews still run on it.
Guide words for a token review
Replace temperatures and pressures with market parameters and the technique transfers cleanly.
More. Liquidity removed faster than the pool can absorb, or buy pressure concentrated in a handful of wallets that coordinate. Less. Trading volume collapsing while holder count stays flat, which usually means the "community" is one operator cycling funds. Reverse. A creator wallet that accumulated earlier now distributing into fresh addresses. Other than. Wallet activity that doesn't match a normal buyer: same funding source as the deployer, near-identical entry timing, identical position sizes.
The output isn't a score. It's a list of deviations with causes, consequences, existing safeguards (LP lock duration, renounced authorities), and named owners with review dates.
What it's good at. It converts tacit knowledge into a repeatable review and catches the boring hazards a single analyst skips. Structure pays off at the program level too: EY's 2025 survey of 500 third-party-risk executives found 57% of organizations ran centralized, enterprise-wide programs, and those programs reported more mature assessment methodologies than hybrid structures, 49% versus 33% (EY global third-party risk management survey).
The trade-off. It needs people and calendar time. For a solo trader working alone, running full HAZOP sessions on every token is the wrong use of an evening. As the review layer sitting on top of a scoring system, it's the best blind-spot finder in this list.
4. Bow-Tie Analysis
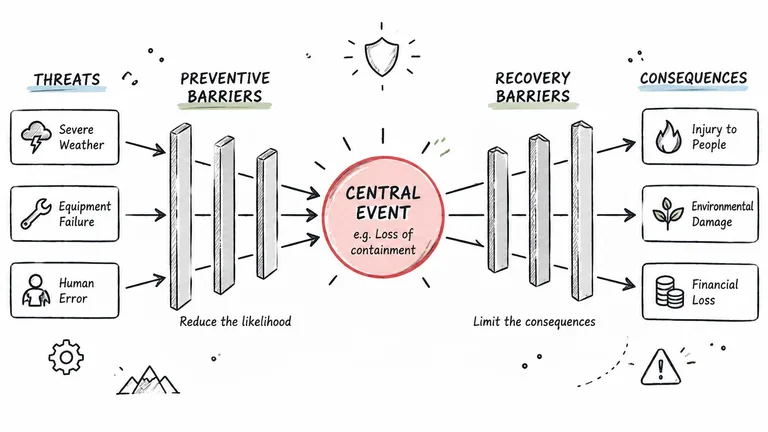
Bow-tie analysis puts a single top event in the center, with fault-tree logic on the left as threats and preventive barriers, and event-tree logic on the right as consequences and mitigative barriers. Set the top event as loss of trader funds from token failure, and both sides stay anchored to the outcome you care about.
Two questions, one diagram
The left side asks what stops the bad thing from happening: holder distribution checks, LP lock verification, mint and freeze authority checks, creator wallet history. The right side asks what limits damage once it happens: position sizing, pre-set exit levels, exit-liquidity thresholds, and refusing to sign whatever the site asks for.
That second side is where most token research stops short. A clean contract doesn't protect you from a wallet-drain prompt or a bridge dependency. FATF's June 2025 targeted update notes stablecoins above USD 300 billion in market capitalization and flags risks from unhosted wallets, peer-to-peer transfers, cross-chain activity, and uneven controls across jurisdictions, citing Chainalysis data that put more than USD 2.17 billion stolen from crypto services by mid-2025, with personal-wallet compromises at 23.35% of stolen-fund activity year to date (FATF targeted update on virtual assets and VASPs). Your token analysis can be correct and you can still lose the money at the signing step.
Practical rule: If a risk report doesn't tell you what to do after the flag, it's half a bow-tie.
Barrier logic reads faster as a walkthrough than as prose, especially the first time you build one.
Where it breaks. It quantifies nothing on its own, and a bow-tie with fifteen barriers per side is unreadable. Cap it at four or five per side, and re-check barrier status after each analysis run to see which controls held.
5. ISO 31000 Risk Management Framework
ISO 31000 is the umbrella. It defines risk as the effect of uncertainty on objectives and lays out a cycle: establish context, identify, analyze, evaluate, treat, with monitoring and communication running through all of it. Banking, insurance, public sector, and corporate risk programs use it, and most regulated internal risk policies borrow its shape.
Framework first, technique second
The common mistake is treating ISO 31000 as an assessment method. It isn't one. Pair it with ISO 31010 when you need to choose a technique, then bolt on FMEA, FTA, or a bow-tie for the actual analysis. The framework supplies governance discipline: a written risk appetite for how much rug exposure you'll accept on a position, documented assumptions, and a trigger for reassessment.
That discipline is rarer than it sounds. In a 2025 global survey of 567 risk professionals, 59% of organizations still relied primarily on word-processing files or spreadsheets, only 21% used dedicated governance, risk and compliance platforms, and only 6% frequently used AI to identify risks (IIA research on enterprise risk management and strategic decisions).
What good looks like: Every assessment carries a timestamp, the evidence used, the model version, and the date it must be redone.
Where it breaks. ISO 31000 produces no score and no priority order. For meme coins, where liquidity and holder structure shift in minutes, a framework without live data and a firm reassessment cadence is paperwork. If you want to see how a defined scope, a timestamped evidence snapshot, and a fixed review cadence combine in a working system, the published ranking methodology is a reasonable reference point.
6. Factor Analysis of Information Risk (FAIR)
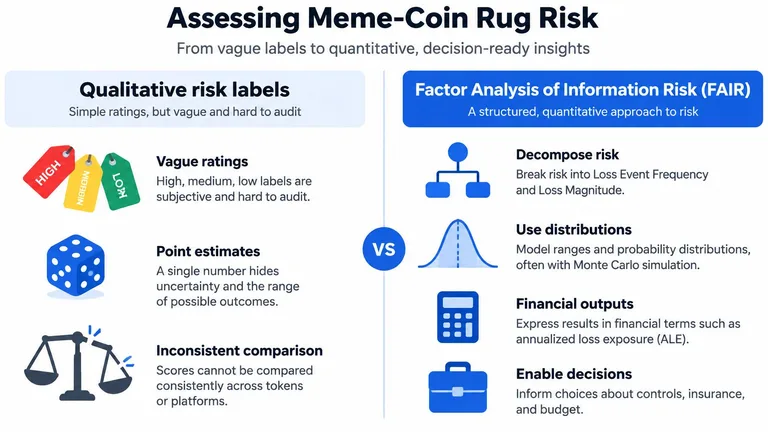
FAIR expresses risk in money. It splits loss into loss event frequency and loss magnitude, breaks each into measurable sub-factors, and simulates ranges instead of guessing a single number. It's the most widely used model for quantitative cyber risk analysis and appears in cyber insurance pricing discussions and board reporting.
A minimum viable FAIR model for a token
Skip the full ontology. Start with two inputs and a range on each.
Frequency. How often does a rug or liquidity pull hit tokens of this class in a given window? Use an observed count over a defined period, not a feeling about the timeline. Magnitude. Expected loss on your position size if it happens, including the slippage you'd take exiting a thin pool.
Multiply across minimum, most likely, and maximum, then report an expected-loss range. "Between 3% and 18% of position, most likely 8%" changes behavior in a way "high risk" never does.
Where the numbers get soft
The frequency input is where people cheat. A token with thin history has no base rate, so you borrow from a broader class and state that you did. NIST's AI Risk Management Framework asks for exactly this discipline: quantitative, qualitative, or mixed-method measurement, benchmark comparisons, uncertainty measures, and monitoring after deployment (NIST AI Risk Management Framework). A stated range with a confidence level beats a four-decimal score.
The trade-off. FAIR takes hours and expects real loss data. That's appropriate for a position you'd size at five figures and absurd for a 0.4 SOL punt. Match the rigor to the exposure, or you'll stop doing the analysis at all.
7. Value at Risk (VaR)
VaR answers one question: over a stated horizon and confidence level, what's the most you'd expect to lose in a normal market? A one-day 95% VaR of 12% means roughly one day in twenty should be worse than that. J.P. Morgan's RiskMetrics system popularized the measure, and Basel capital frameworks built on VaR-style approaches, which is why it became the shared language of market risk.
Three ways to compute it, and which one survives meme coins
Historical simulation replays actual past moves. Useful when you have enough history, useless for a token that launched last week. Parametric methods assume a distribution shape. Meme coin returns don't fit one, so tail estimates go wrong in the direction that costs you money. Monte Carlo samples repeatedly from assumed inputs. Flexible, but it inherits whatever assumptions you fed it.
The tail is the whole story
VaR says nothing about how bad the worst 5% gets. Pair it with Expected Shortfall or an explicit stress case: liquidity gone, exit slippage, a 60% drawdown inside one candle. Thin liquidity also means modeled loss understates realized loss, because your own exit moves the price against you.
Size positions on the worst plausible loss, not the average one.
The Basel Committee's operational-risk standard required banks to target a soundness standard comparable to a one-year holding period at a 99.9% confidence interval, backed by at least five years of internal loss data and independent model validation (Basel framework, operational risk). The lesson scales down: choose the horizon deliberately, keep enough history to check the model, and let someone other than the model's author test it. VaR is one input, not a verdict, and it sits alongside token-specific checks in the meme coin risk score.
7 Risk Assessment Methodologies Compared
| Method | Approach | Output | Best For | Main Limitation |
|---|---|---|---|---|
| Failure Mode and Effects Analysis (FMEA) | Bottom-up review; scores failure modes by severity, occurrence, and detectability | Ranked risks by Risk Priority Number or action priority | Identifying and prioritizing component-level failures | Subjective scoring; rankings can mislead and combinations of failures are not naturally captured |
| Fault Tree Analysis (FTA) | Top-down analysis using AND/OR logic to trace causes of an undesired event | Fault tree, minimal cut sets, and optionally event probabilities | Understanding combinations of causes behind a major event | Can become complex and depends on reliable probability data |
| Hazard and Operability Study (HAZOP) | Team review applies guide words to process parameters to identify deviations | Documented causes, consequences, safeguards, and actions | Structured hazard reviews drawing on multidisciplinary expertise | Time-intensive and designed mainly for physical process systems |
| Bow-Tie Analysis | Maps threats and preventive barriers before an event, then consequences and mitigative barriers after it | Visual summary of causes, controls, consequences, and recovery measures | Communicating risk controls and gaps clearly | Can oversimplify interactions and is limited for quantitative estimates |
| ISO 31000 Risk Management Framework | Organization-wide cycle for identifying, analyzing, evaluating, treating, and monitoring risk | Risk governance framework and management process | Establishing a flexible, organization-wide approach to risk | Does not prescribe specific scoring methods or calculations |
| Factor Analysis of Information Risk (FAIR) | Quantifies loss event frequency and loss magnitude using ranges and probability distributions | Probabilistic financial loss estimates | Comparing risks and informing financial or control decisions | Requires calibrated estimates, data, and training |
| Value at Risk (VaR) | Estimates portfolio loss over a time horizon at a chosen confidence level | Single loss estimate for a specified horizon and confidence level | Market-risk reporting, position sizing, and limit setting | Misses losses beyond the confidence threshold and can understate extreme or illiquid-market risk |
Choosing and Combining Your Risk Assessment Stack
A rug pull rarely fails for one reason, so no single methodology will cover the whole decision. Match each method to the question it answers, then layer them.
Component failure modes. FMEA when you need item-by-item coverage of how a token breaks: thin liquidity, concentrated holders, a mint authority that is not locked, a creator wallet with prior launches.
Causal combinations. FTA when you want the minimal set of conditions behind a rug and a threshold you can monitor, such as top-wallet share plus liquidity depth below your intended exit size.
Blind spots. HAZOP when a team reviews together and guide words keep the session honest.
Prevention and recovery. Bow-tie when the reader needs both sides in one picture: the barriers that stop a loss on the left, the ones that cap it on the right.
Governance. ISO 31000 as the umbrella process, with a written risk appetite and a reassessment cadence.
Money. FAIR for expected-loss ranges, VaR for horizon-based position limits. On illiquid meme pairs, treat VaR output with care, since the estimate understates gaps outside its confidence level.
A stack that works in practice: ISO 31000 as the governing process, FMEA or FTA for analysis, bow-tie for communicating barriers to someone who isn't an analyst, FAIR or VaR for sizing. Then add a feedback loop. A method that never gets checked against outcomes is just a preference with a spreadsheet attached.
MemeAssist covers the evidence side of that stack in one Solana report. Its analysis checks six signal categories: liquidity, holder distribution, creator behaviour, wallet activity, trading patterns, and historical risk indicators. Each full report returns an Overall Health Score, a Rug Risk Rating, a plain-English AI Verdict, and a Detailed Risk Breakdown, plus a conditional trade plan when the data allows. Flagged tokens are tracked for 24 hours afterward, with outcomes fed back into the screening engine, which is the calibration loop most ad hoc stacks skip. New users start with one free full analysis and no wallet connection, so run a token you're considering through MemeAssist and compare the barriers its breakdown names against your own exit plan. Treat a lower rug risk rating as context for research, never as a safety guarantee.
Topics: best risk assessment methodology, risk assessment methods, FMEA, FAIR, risk management frameworks
Informational only, not financial advice. Meme coins are extremely high-risk.
All articles