Crypto Take Profit Calculator: How to Use It Right
Learn how to use a crypto take profit calculator correctly. Covers formulas, worked examples, risk metrics, and a downloadable spreadsheet template.
Published
Updated
Your token is up, the chart still looks strong, and you've entered a target into a calculator. Then you open the swap screen. The estimated proceeds are lower than expected, the quote changes, and suddenly the decision isn't about what profit you want. It's what profit you can collect.
A crypto take profit calculator should help you answer that question before you're under pressure. For Solana meme coins especially, useful profit planning connects arithmetic with executable quotes, token risk, and a clear reason to exit.
Table of Contents
- Why a Take Profit Calculator Is More Than a Percentage Multiplier
- The Inputs and Formulas Behind Every Calculation
- Why Liquidity and Slippage Can Break Your Target
- Using MemeAssist Risk Outputs to Set Realistic Targets
- Choosing Targets Based on Holding Period and Market Regime
- Building Your Own Spreadsheet Take Profit Calculator
- Putting It All Together for Smarter Exits
Why a Take Profit Calculator Is More Than a Percentage Multiplier
You set a target, price approaches it, and you decide to wait for a little more. Buyers stop following through. By the time you return to the swap screen, the attractive gain exists only in your trade history.
That's a hypothetical situation, not a trading case study. But it exposes the limitation of a calculator that answers only one question: what price produces the return you typed in?
Start with what you can lose
Bitcoin's historical peak-to-trough declines include approximately 93.8% in 2011, 86% from 2013 to 2015, 84% in 2018, and 77.5% in 2022; a token that falls 80% needs a 400% recovery just to regain its starting value, illustrating the loss-recovery asymmetry described in this explanation of crypto drawdowns.
The practical lesson isn't that every position will suffer a catastrophic decline. It's that waiting to recover can require a much larger move than the decline initially suggests. A profit objective without a downside plan leaves an important part of the decision unfinished.
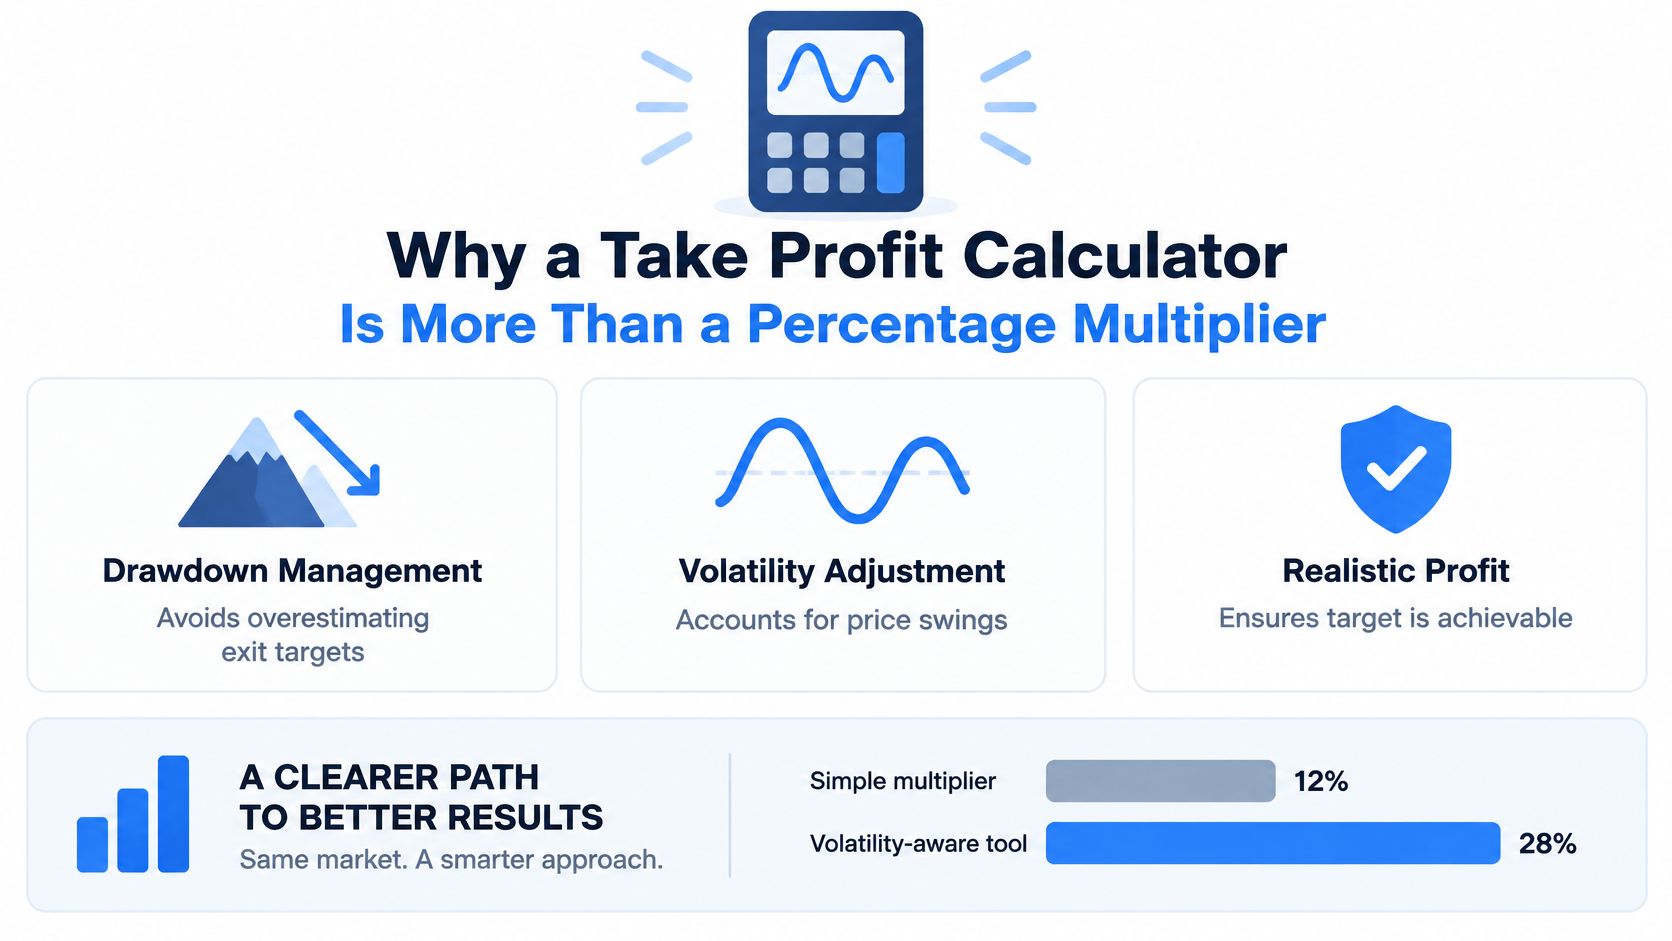
Treat the calculator as a drawdown-management worksheet, not a prediction engine. Before committing capital, specify:
- The intended exit: Where you'd like to sell if the trade develops as expected.
- The invalidation condition: What price action or token-risk change would make you abandon the trade.
- The capital at risk: What you're prepared to lose if execution deteriorates.
- The fallback decision: Whether you'll reduce exposure, exit completely, or stop adding.
The distinction between simple arithmetic and a risk-aware calculation is illustrated below.
A target isn't an instruction to hold indefinitely
A higher target gives you more potential upside, but it also requires remaining exposed while you wait. That trade-off deserves an explicit decision rather than an optimistic default.
Practical rule: Choose the conditions under which you'll stop waiting before choosing how much profit you want.
Your worksheet should distinguish gross profit, estimated trading costs, potential tax obligations, and the price needed to break even. Those outputs won't make an uncertain trade safe. They will make the consequences of your assumptions easier to inspect.
A useful calculator lets you compare an attractive outcome with an uncomfortable one. If the position is only acceptable when everything goes right, changing the target percentage won't fix the underlying exposure.
The Inputs and Formulas Behind Every Calculation
Use actual acquisition records wherever possible. A chart price is not necessarily your entry price, and the amount you intended to spend isn't necessarily your final cost.
Define the inputs consistently
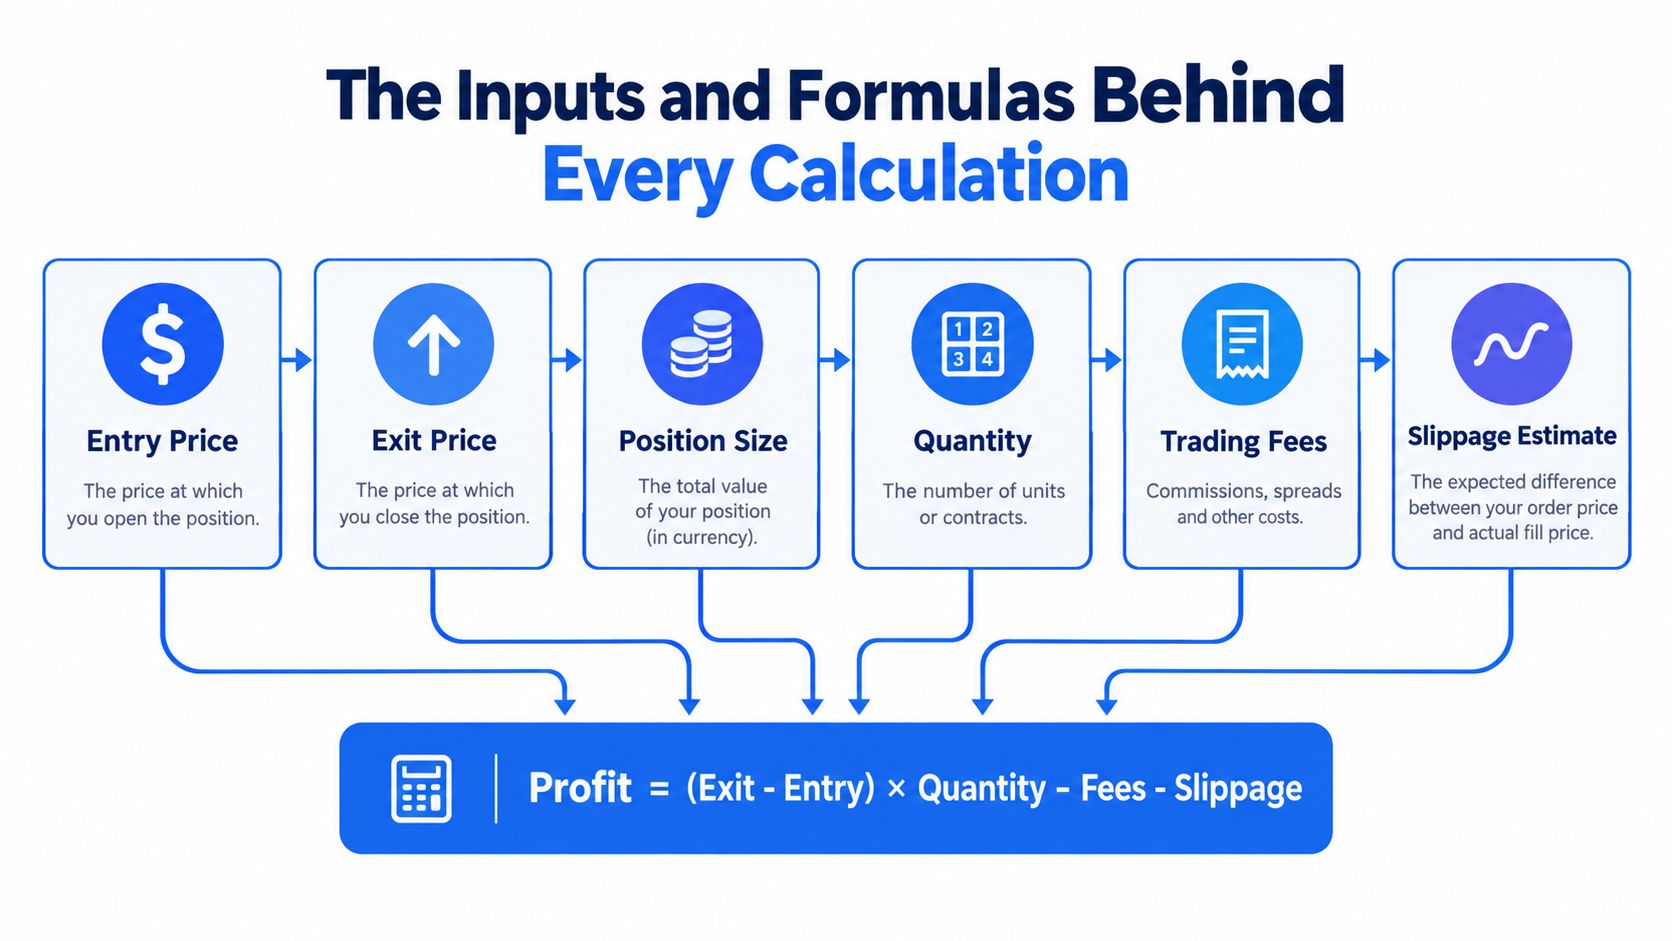
The essential inputs describe both the position and the planned sale:
- Entry price: Your executed purchase price, or the applicable acquisition cost for the units being sold.
- Exit price: The assumed sale price before any separately modeled execution adjustment.
- Quantity: Tokens available for the planned exit, excluding units already sold.
- Fees: Entry and exit expenses, recorded consistently rather than deducted twice.
- Slippage estimate: An execution allowance when the exit price hasn't already been adjusted.
- Tax estimate: A separate planning input based on your circumstances, not an automatic universal deduction.
Keep position value and quantity separate. Position value describes capital committed; quantity determines how much a price change adds to or subtracts from your result.
This diagram summarizes the relationship between the inputs.
Check the arithmetic manually
For a long position, use these relationships:
- Gross profit: Quantity × (exit price − entry price).
- Net trading profit: Gross profit − entry fees − exit fees − separately estimated execution costs.
- Return on capital: Net trading profit ÷ total acquisition outlay, expressed as a percentage.
- Break-even exit price: (Acquisition cost + fixed exit costs) ÷ quantity, when execution costs are fixed monetary estimates.
If selling costs depend on sale value, break-even needs to account for that dependency. Don't use the fixed-cost formula unchanged and assume the answer remains exact.
Avoid double-counting slippage. If you enter an execution-adjusted average sale price, don't subtract the same estimated shortfall again. Likewise, when acquisition cost already includes entry fees, don't deduct them again from profit.
Keep tax estimates separate from trading performance
For example, buying $1,000 of a token and selling for $1,500 produces a $500 gross gain before costs and tax treatment; the IRS has treated cryptocurrency as property since 2014, and broker gross-proceeds reporting through Form 1099-DA began with the 2025 tax year, as described in this report on crypto tax reporting.
That gross gain is a starting point, not spendable after-tax profit. Preserve transaction dates, quantities, acquisition costs, sale proceeds, and fees so you can reconcile the calculation later.
Keep an estimated tax reserve in a separate field. Taxable gains can depend on jurisdiction, holding period, and cost-basis treatment, so a flat-rate estimate shouldn't masquerade as a completed tax calculation.
Why Liquidity and Slippage Can Break Your Target
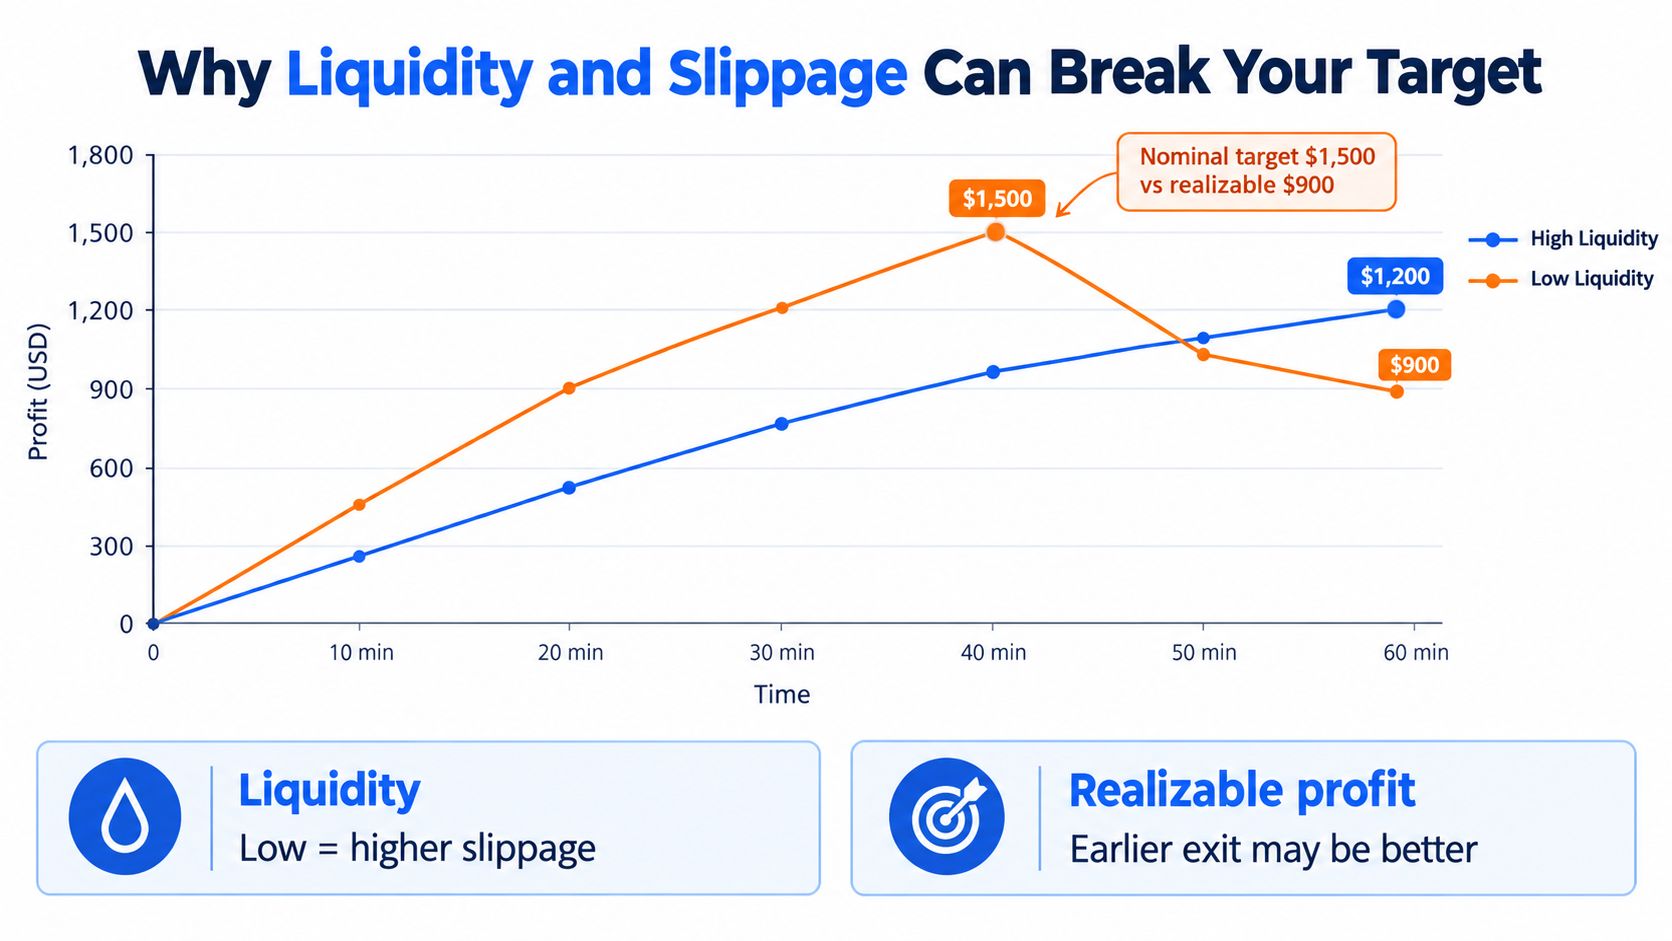
A displayed token price doesn't tell you what your entire position will sell for. The relevant input is the average executable price for the quantity you intend to sell.
Research covering January 2024 through March 2025 identified more than 7 million Pump.fun tokens with at least five trades, but only about 97,000 retained liquidity above $1,000; the same reporting described soft-rug characteristics in approximately 93% of 388,000 Raydium pools, while a separate trading-data analysis found 21% of Solana DEX trades in its year-to-date sample experienced at least 3% slippage, according to this report on Solana meme-coin liquidity and trading risks.
Those findings describe particular samples, not the probability that your next trade will fail. They do explain why checking price alone is an inadequate execution test.
The chart below is an illustration of the mechanism, not a historical trading record.
Test the sale rather than the headline price
Use a Solana liquidity checker to inspect pool conditions, then compare those conditions with an executable quote for your intended size. Total liquidity is context; it isn't a promise that your sale can clear near the displayed price.
Distinguish the sources of execution loss:
- Price impact: The effect your own order has on the available liquidity.
- Slippage: The difference between the expected execution and the eventual fill.
- Spread or route costs: The difference between displayed reference pricing and what the available route offers.
- Liquidity withdrawal: A change that can invalidate your estimate before you execute.
Request quotes for both the planned sale and a smaller portion. A disproportionately worse average price for the larger sale is a reason to reconsider position size or execution method.
This video provides additional context for the execution discussion.
Staged selling has a cost
Selling in portions can reduce the impact of an individual order and preserve flexibility. It also creates additional transactions and leaves the unsold balance exposed.
An earlier, smaller gain can be preferable to a higher target that you can't execute.
Don't confuse slippage tolerance with an expected cost. Raising tolerance permits a worse execution; it doesn't improve liquidity or guarantee a successful exit.
For planning, retain both a current-quote outcome and a stressed outcome. If the quote becomes unavailable, the honest output is execution uncertain, not a reassuring profit figure derived from an old price.
Using MemeAssist Risk Outputs to Set Realistic Targets
A risk report should change your assumptions, not merely reassure you after you've chosen a target. Read it as evidence about the conditions under which your exit might become difficult.
The report interface below shows the scoring and explanation format.
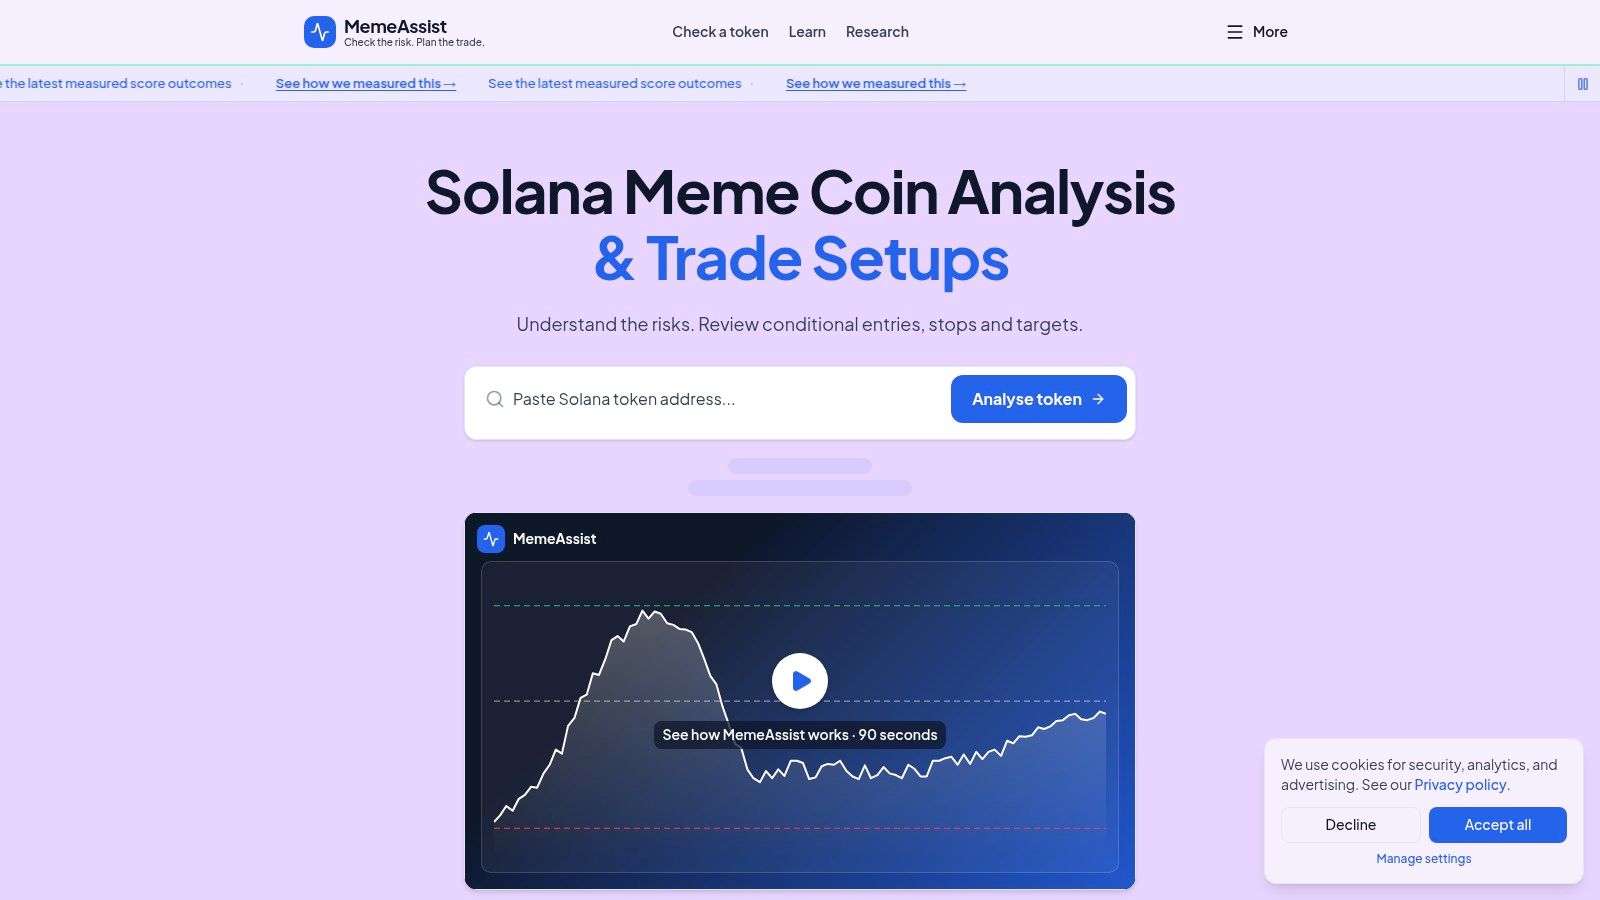
Read beyond the summary score
The meme coin risk score provides a starting point for reviewing the evidence. Use the outputs for different decisions rather than treating them as interchangeable buy-or-sell signals.
| Report output | Question to ask | Implication for the calculator |
|---|---|---|
| Overall Health Score | What deserves closer inspection? | Identify assumptions that need verification |
| Rug Risk Rating | Are there structural reasons to avoid exposure? | Consider whether a target is appropriate at all |
| AI Verdict | Does the explanation match the underlying checks? | Translate the narrative into explicit conditions |
| Detailed Risk Breakdown | Which observed signals could disrupt the trade? | Adjust size, execution assumptions, or exit timing |
A favorable summary isn't a guarantee of safety. An unfavorable structural finding may justify skipping the trade rather than compensating with a more modest target.
Turn evidence into conditional decisions
Consider a hypothetical token with concentrated ownership and shallow liquidity. Large holders could represent substantial potential selling pressure relative to available buyers. A practical response is to reduce intended exposure, test smaller sale quotes, or reject the setup if an orderly exit appears doubtful.
Holder concentration alone doesn't prove coordinated selling. Inspect wallet roles and the supporting evidence instead of assuming every large balance belongs to an insider.
Creator behavior deserves separate attention. If the report flags suspicious creator-linked activity, don't treat a strong chart as a rebuttal. Ask whether the activity undermines your reason for holding, and record what further evidence would trigger an exit.
- Wallet activity: Check whether apparent participation comes from varied wallets or activity flagged as potentially coordinated.
- Trading patterns: Review bundle or insider indicators before interpreting busy trading as independent demand.
- Historical indicators: Use relevant prior behavior as context, not proof of what must happen next.
The Trade Setup output can summarize opportunity and risk context, but you still need to translate that context into a decision you can execute. Record the observation, your interpretation, and the action separately.
For example, improving distribution and a stable sale quote might support keeping a remaining position open. Deteriorating creator signals might invalidate that plan regardless of the price target. These are conditional planning choices, not claims that the report predicts future returns.
Choosing Targets Based on Holding Period and Market Regime
A target makes little sense without an expected holding period. Waiting for a distant price objective is a different decision when participation is expanding than when buyers are disappearing.
Galaxy reported that the median holding time for Solana meme coins completely sold within seven days fell to roughly 100 seconds, from nearly 300 seconds a year earlier; its discussion also noted Solana DEX daily traders declining from 4.8 million at the start of 2025 to 900,000 in August, alongside daily transactions falling from 45 million to 28.8 million, in its research on Solana meme-coin trading.
The holding-time finding concerns a defined group of completed positions. It isn't a recommended holding period, and it doesn't describe every token. Its value is showing why a static target can be poorly matched to the trading environment.
Match the exit rule to the setup
Use a meme season index as broader context, then compare it with token-specific activity. A lively ecosystem doesn't establish that buyers remain interested in your particular position.
| Observed conditions | Planning response | Trade-off |
|---|---|---|
| Participation and executable demand are strengthening | Retain conditional upside exposure | You remain exposed to reversal |
| Price rises while participation weakens | Bring forward a review or partial exit | You may sell before another advance |
| Activity stalls after the initial launch | Apply a time-based reassessment | A later recovery could occur without you |
| Broader participation contracts | Require stronger token-specific evidence | You may pass on isolated winners |
A time stop is a rule to reassess or close a position when the expected development hasn't occurred within your chosen window. It doesn't require waiting for a price-based loss limit.
Define what earns more time
Write down the observations that justify staying in: sustained executable demand, continued participation, or the absence of your invalidation signals. Avoid vague conditions such as the community still seems excited.
Decision test: If you didn't already own the token, would the current evidence justify this much exposure?
Partial exits can separate decisions that traders often bundle together. You can reduce the amount at risk while keeping a smaller balance exposed to a continuing move.
That approach still needs a rule for the remainder. Without one, partial profit-taking can become an excuse to stop monitoring a position whose original rationale has disappeared.
Building Your Own Spreadsheet Take Profit Calculator
Build the spreadsheet around auditable inputs, not a single oversized profit cell. Use named ranges so the formulas remain readable when you return to the file later.
Lay out the calculation
Create an input area, an output area, and a separate transaction log. The following layout uses monetary execution costs, avoiding ambiguity about whether a percentage applies to entry value or sale proceeds.
Spreadsheet Calculator Columns
| Input | Formula | Purpose |
|---|---|---|
| EntryPrice | Manual input | Records the acquisition price assumption |
| Quantity | Manual input | Defines the units being evaluated |
| EntryFees | Manual input | Captures acquisition expenses |
| ExitPrice | Manual input | Sets the unadjusted target price |
| ExitFees | Manual input | Estimates selling expenses |
| ExecutionCost | Manual input | Records expected execution shortfall |
| AcquisitionOutlay | =EntryPrice*Quantity+EntryFees |
Establishes total capital committed |
| GrossProfit | =(ExitPrice-EntryPrice)*Quantity |
Shows the price-only outcome |
| NetProfit | =GrossProfit-EntryFees-ExitFees-ExecutionCost |
Estimates trading profit |
| ReturnOnCapital | =NetProfit/AcquisitionOutlay |
Displays return when formatted as a percentage |
| BreakEvenPrice | =(AcquisitionOutlay+ExitFees+ExecutionCost)/Quantity |
Estimates break-even under fixed-cost assumptions |
| TaxReserve | Manual input | Separates tax planning from trading performance |
| EstimatedRetainedProfit | =NetProfit-TaxReserve |
Shows profit after the planning reserve |
Use positive quantities and flag incomplete inputs rather than allowing blank fields to look like verified assumptions. For purchases across multiple lots, keep the transaction log detailed enough to support your applicable cost-basis method.
Add an execution adjustment
Create a separate row for quoted proceeds at the intended sale size. Compare those proceeds with the unadjusted target value and record the difference as the execution estimate, provided the quote's fee treatment is clear.
- For liquid assets: Refresh the quote and check whether the intended order materially changes the average sale price.
- For new meme coins: Add liquidity observations, quote timestamps, and risk-review notes beside the calculation.
- For staged exits: Track each completed sale separately and reduce the remaining quantity.
Don't derive a universal slippage estimate from total pool liquidity alone. If you lack a credible quote, mark the scenario as unverified.
Add a warning field for stale quotes, missing routes, or unacceptable execution-adjusted proceeds. Save the workbook as a reusable template or export it as a downloadable file for your own workflow. Preserve transaction dates and actual fills so estimates can later be compared with results.
Putting It All Together for Smarter Exits
The strongest exit plan connects a reason to hold with a reason to sell. A calculator supplies the arithmetic, but you supply the conditions that make the arithmetic relevant.
Consider a hypothetical token whose report shows concentrated ownership, mixed creator signals, and limited executable depth. The chart looks attractive, but the intended position is difficult to unwind at the displayed price. The useful decision isn't to invent a more exciting target.
Rehearse the decision before placing the trade
Start by deciding whether those findings justify any exposure. If they do, test a smaller position against the available route and enter the resulting assumptions into the worksheet.
Write down what would invalidate the trade, what would justify retaining a balance, and what you'll do if the quote worsens. If you choose staged selling, make each stage conditional on actual execution rather than assuming every planned sale will occur.
- Before entry: Confirm that the intended position fits both your loss tolerance and the available exit conditions.
- While holding: Review changes that matter to your original rationale, not every fluctuation on the chart.
- After selling: Replace estimates with actual proceeds and record why you acted.
Judge the process honestly
Don't judge an exit solely by whether the token later traded higher. Ask whether you followed the evidence and obtained an acceptable result under the conditions available at the time.
Common mistakes are operational: using stale quotes, leaving old quantities in the worksheet, overlooking changed risk signals, or treating a planned sale as completed. A disciplined review should catch those errors without pretending that any tool eliminates uncertainty.
A crypto take profit calculator is useful when it helps you make a decision you can carry out. The objective isn't the largest number on the screen. It's a repeatable process for converting an acceptable opportunity into a recorded outcome.
MemeAssist offers on-demand Solana token reports with live liquidity checks, holder and creator analysis, risk ratings, and a plain-English explanation of the evidence. Visit MemeAssist before setting your next take-profit target, then use the findings to test your position size, execution assumptions, and exit conditions.